Chapter 4 Mothers’ SCB Intake and Body Composition of their Children
This chapter is based on
Vincent Jen, Nicole S. Erler, Myrte J. Tielemans, Kim V.E. Braun, Vincent W.V. Jaddoe, Oscar H. Franco and Trudy Voortman. Mothers’ intake of sugar-containing beverages during pregnancy and body composition of their children during childhood: the Generation R Study. The American Journal of Clinical Nutrition, 2017; 105(4), 834–841. doi:10.3945/ajcn.116.147934
Abstract
Background: High intake of sugar-containing beverages (SCBs) has been linked to increased risk of obesity. However, associations of SCB intake during pregnancy with child body composition have been unclear.
Objectives: We explored whether SCB intake during pregnancy was associated with children’s body mass index (BMI) and detailed measures of body composition. In addition, we examined different types of SCBs (i.e., fruit juice, soda, and concentrate).
Design: We included 3312 mother-child pairs of the Generation R Study, a prospective cohort from fetal life onward in the Netherlands. Energy-adjusted SCB intake was assessed in the first trimester with a food-frequency questionnaire. Anthropometric data of the children were collected repeatedly until six years of age, and BMI was calculated. At six years of age, we further measured the fat mass index (FMI) and fat-free mass index with dual-energy X-ray absorptiometry. All outcomes were sex- and age-standardized. Associations of SCB intake with children’s body composition and BMI trajectories were analysed with multivariable linear and multivariable linear mixed models.
Results: Results from linear mixed models showed that, after adjustment for confounders including the SCB intake of the child itself, mothers’ total SCB intake was positively associated with children’s BMI until six years of age (per serving per day: 0.04 SD score (SDS); 95% CI: [0.00, 0.07]). In addition, intakes of total SCBs and fruit juice, but not of soda or concentrate, were associated with a higher FMI (total SCBs: 0.05 SDS, 95% CI: [0.01, 0.08]; fruit juice: 0.04 SDS, 95% CI: [0.01, 0.06]) of the six-year-old children. These associations remained significant after additional adjustment for gestational weight gain, birth weight, and children’s insulin concentrations.
Conclusion: Our study suggests that maternal SCB intake during pregnancy is positively associated with children’s BMI during early childhood and particularly with higher fat mass.
4.1 Introduction
The rapidly increasing prevalence of childhood overweight and obesity is of great concern because excess weight during childhood is associated with health problems over the child’s life course, including cardiometabolic disturbances (Batch and Baur 2005). Intake of sugar-containing beverages (SCBs) has increased substantially during the past decades (Malik et al. 2010). Several studies have revealed that high intakes of SCBs by adults and children are related to overweight and obesity (Malik et al. 2010; Krebs and Jacobson 2003; Leermakers et al. 2015). Although this relation has been well established in the general population, the association of pregnant women’s SCB intake with their offspring’s growth and body composition has been unclear. Intake of SCBs during pregnancy may influence the intrauterine programming of the child toward obesity (Phelan et al. 2011). Potential effects of SCB intake during pregnancy on child body composition may be hypothesized by several mechanisms including changes in the insulin response.
To our knowledge, only one study has prospectively investigated the association between intake of SCBs during pregnancy and child body weight (Phelan et al. 2011). In a US cohort of 285 mothers and their infants, Phelan et al. (2011) observed that intakes of soft drinks and fruit juice during pregnancy were not associated with child birth weight or weight at 6 months of age. However, the later onset of childhood overweight and obesity was not explored. Also, more detailed measurements of body composition (i.e., fat mass and lean mass) were not explored in the study. Previous studies in the general population have suggested that higher intake of SCBs may be associated with a higher fat mass but not lean mass (Zheng et al. 2015; Raben et al. 2002; Tordoff and Alleva 1990). Therefore, we hypothesized that mothers’ SCB intakes during pregnancy would be associated with higher BMI (in kg/m2) and, in particular, with higher fat mass in their children.
The aim of this study was to explore the associations of mothers’ SCB intakes during early pregnancy with BMI trajectories of their children until six years of age and with the children’s fat masses and fat-free masses at six years of age. In addition, we analysed whether these associations differed by types of SCBs (fruit juice, concentrate, and soda).
4.2 Methods
4.2.1 Study Design
This study was embedded in the Generation R Study, which is an ongoing population-based prospective cohort from fetal life onwards in Rotterdam, the Netherlands. Details of the study design and procedures have been described previously (Kooijman et al. 2016). The study was approved by the Medical Ethics Committee at the Erasmus Medical Center. Pregnant women with an expected delivery date between 2002 and 2006 were included. Written informed consent was obtained for all participants. No measurements were performed when a child was not willing to participate.
4.2.2 Study Population
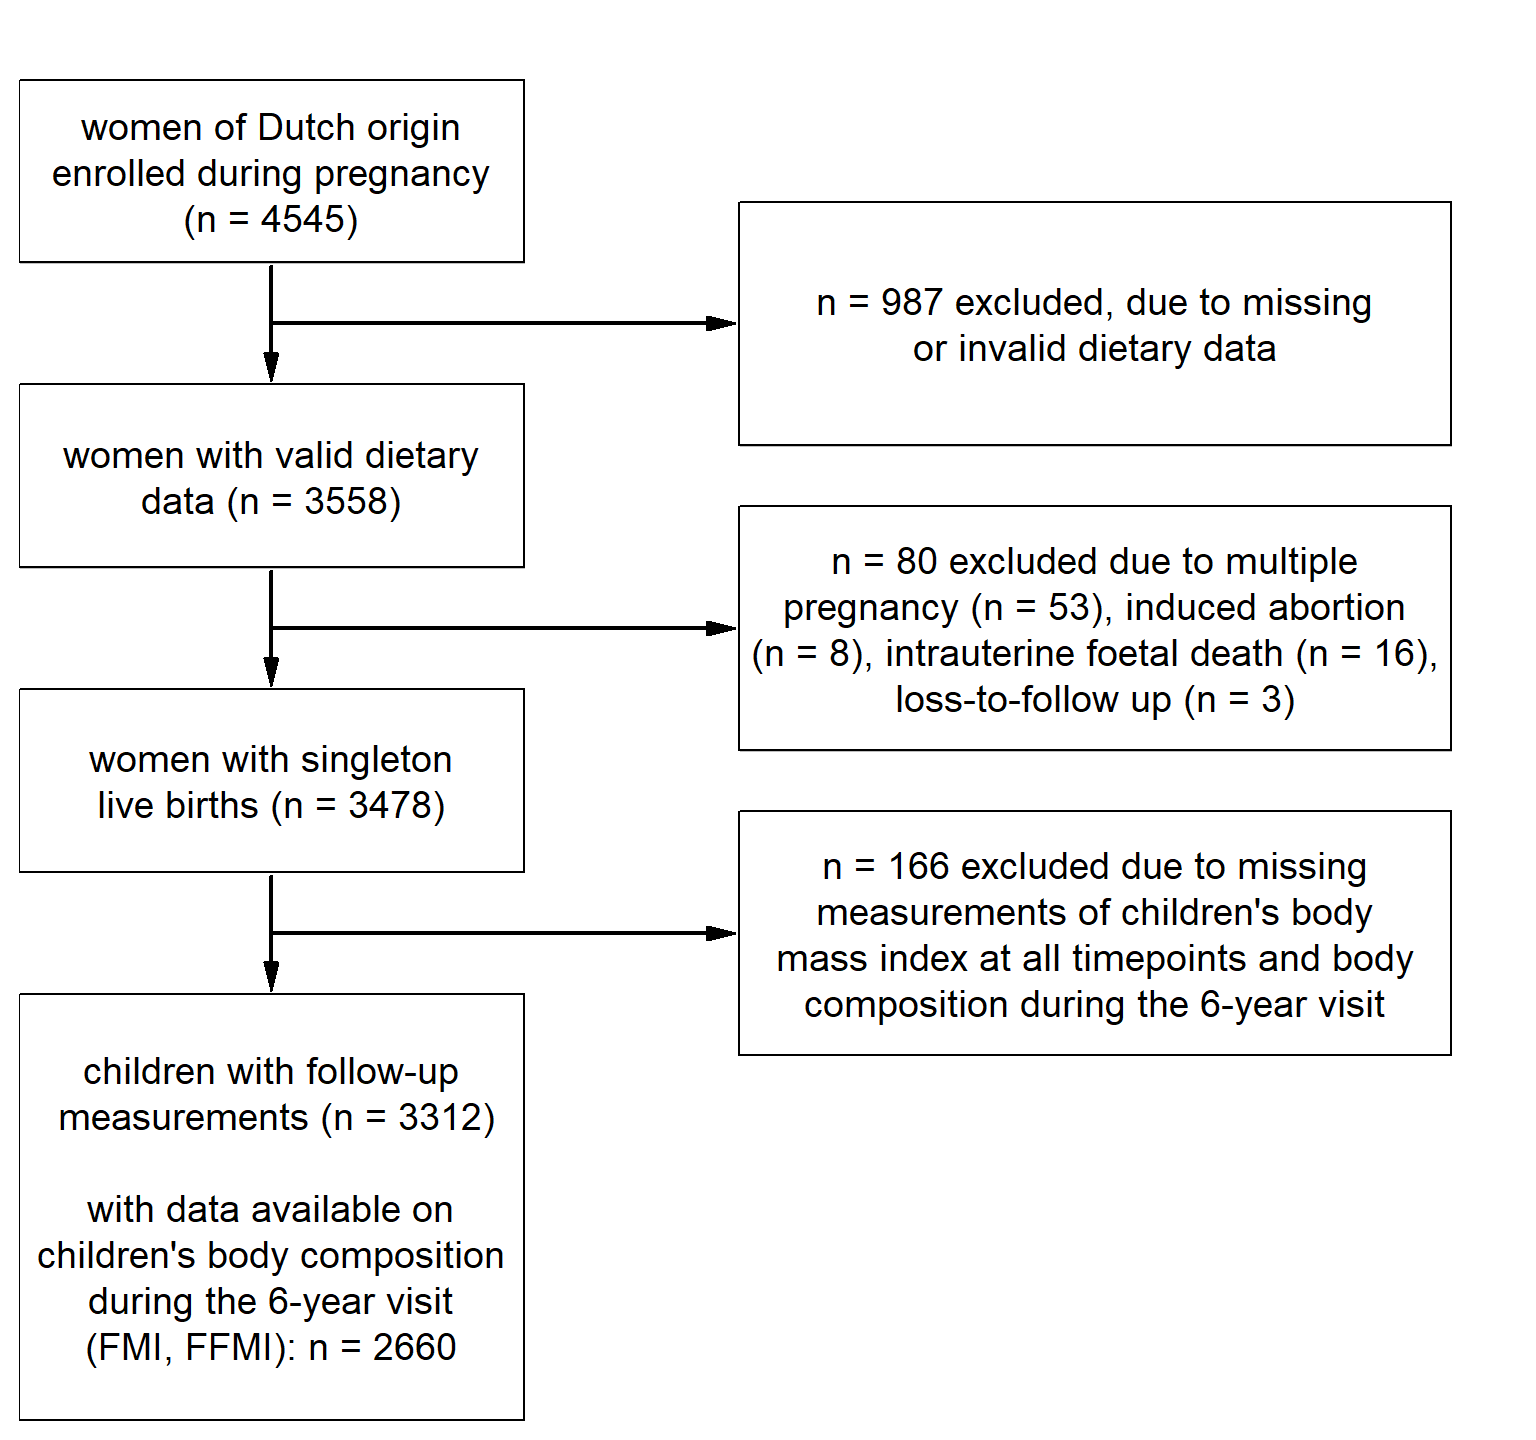
Figure 4.1: Flowchart of the population for analysis.
The selection process of the population for analysis is shown in Figure . We restricted our analyses to women who were of Dutch origin (n = 4545). Of these women, 3558 individuals provided valid dietary data of whom 3478 had singleton live births. Of these children, 3312 had available information on BMI for at least one time point. More detailed body-composition outcomes were available for 2660 children at six years of age.
4.2.3 Dietary Assessment of the Mother
We assessed dietary intake in pregnant women at enrolment (median: 13.4 weeks of gestation; 2.5% and 97.5% quantiles: 9.9 and 22.8 weeks of gestation) with the use of a self-administered semi-quantitative food-frequency questionnaire (FFQ) (Klipstein-Grobusch et al. 1998). The FFQ covered intakes of 293 food items that were consumed in the preceding three months and included questions about their consumption frequencies and portion sizes. We obtained information on the following three types of SCBs: soda (soft drinks, sports drinks, and energy drinks), fruit juice (fresh and boxed; 100% fruit juice only), and concentrate (juice and lemonades concentrate with added sugars). In this study, we defined total intake of SCBs as the sum of soda, fruit juice, and concentrate intakes, which were expressed as servings per day. We chose not to include sugar-containing milk products because of their different macronutrient composition (Malik, Schulze, and Hu 2006). Daily energy and macronutrient intakes of the pregnant women were calculated with the use of the Dutch food-composition table (Netherlands Nutrition Center 2006).
4.2.4 Child Anthropometric Measures and Body Composition
Children visited Child Health Centres at the median (2.5%, 97.5% quantiles) ages of 1.1 months (0.8, 1.8), 2.2 months (2.0, 2.9), 3.3 months (3.0, 3.9), 4.4 months (4.0, 4.9), 6.2 months (5.3, 8.2), 11.1 months (10.1, 12.5), 14.3 months (13.5, 16.0), 18.3 months (17.3, 21.4), 24.9 months (23.4, 28.0), 30.6 months (29.2, 33.8), 36.7 months (35.4, 40.6) and 45.8 months (44.4, 48.5). During all visits, heights and weights of the children were measured with the children not wearing shoes or heavy clothing. When children were a median age of six years (2.5% and 97.5% quantiles: 5.7, 7.4), well-trained staff measured children’s anthropometric variables and body compositions in a dedicated research centre of Sophia Children’s Hospital in Rotterdam (Kooijman et al. 2016). We measured height in a standing position to the nearest millimetre with the use of a Harpenden stadiometer (Holtain Ltd.). Weight was measured with the use of a mechanical personal scale (SECA). BMI was calculated for all time points.
In addition, to measure the body composition of children at six years of age, we used a dual-energy X-ray absorptiometry (DXA) scanner (iDXA; Ge-Lunar, 2008) (Kooijman et al. 2016). The DXA scanner measured fat mass, lean mass, and bone mass of the total body with the use of enCORE software (v.13.6; GE Healthcare). We calculated the fat mass index (FMI) as fat mass (kilograms) divided by the square of height (in meters) and the fat-free mass index (FFMI) as lean mass plus bone mass (both in kilograms) divided by the square of height (in meters). All outcomes were standardized for age and sex on the basis of the Generation R Study population. We used cut-offs that were recommended by Cole et al. (2000) to determine the weight status of each child at six years of age as normal, or as overweight or obese.
4.2.5 Covariates
At enrolment, we used self-administered questionnaires to collect information on maternal age, marital status (no partner, married / living together), education (low or high) (Statistics Netherlands 2003), use of folic acid supplements (never, started during the first 10 weeks, or started periconceptional), parity (nulliparous or multiparous), and net household income (\(<\) € 2400/month or \(\geq\) € 2400/month). Maternal height and weight were measured at enrolment to calculate BMI, and a fetal ultrasound was performed to determine the gestational age. The maternal diet quality (range: 0 to 14) was scored on the basis of adherence to Dutch dietary guidelines with the use of the dietary intake data that were obtained from the FFQ at enrolment. This score included items on intakes of vegetables, fruit, legumes, whole grains, nut, fish, dairy, tea, soft fat and oils, red meat, alcohol, salt, and folic acid supplements (Nguyen et al. 2017). Psychiatric symptoms during pregnancy (Global Severity Index; range: 0 to 4) (Derogatis and Melisaratos 1983) and vomiting (\(\geq 1\) or \(<1\) time/week) were also assessed with the use of questionnaires at enrolment, but also during pregnancy.
With the use of questionnaires, we assessed smoking (never, until the pregnancy was known, or continued during pregnancy) and alcohol consumption (never, until the pregnancy was known, occasionally during pregnancy, or frequently during pregnancy). Body weight was measured in each trimester, and the total gestational weight gain was calculated by subtracting weight that was assessed at enrolment from weight that was measured in the third trimester (Kooijman et al. 2016).
After pregnancy, we obtained information on pregnancy-related diseases including pregnancy-induced hypertension, pre-eclampsia (Coolman et al. 2010), and gestational diabetes from midwives and obstetricians. We collected information on child sex, gestational age, and birth weight from hospital medical records, and \(z\)-scores were calculated for birth weight with the use of reference data (Niklasson et al. 1991). When a child was six years old, information on screen time (watching television and the use of the computer in hours per day), sports participation (yes or no), and intake of SCBs (servings per day) was obtained with the use of a questionnaire. In addition, nonfasting blood was collected at the research centre, and insulin concentrations were analysed with the use of enzymatic methods (Cobas 8000; Roche) (Voortman, van den Hooven, et al. 2016).
4.3 Statistical Analyses
To reduce bias due to missing values (\(\leq 22.8\%\) per covariate), we used a fully Bayesian approach that allowed for simultaneous imputation of missing covariates and analysis of associations with multiple cross-sectional and longitudinal outcomes. A detailed description of this approach can be found elsewhere (Erler et al. 2016). Results of the main analyses were obtained directly from the Bayesian approach and are presented as posterior means and 95% credible intervals (CIs). To perform subsequent sensitivity analyses, 10 imputed datasets were created by random selection of imputed values from the Bayesian approach. These analyses were performed separately in each of the imputed datasets, and pooled effect estimates and 95% confidence intervals (CIs) are presented. All decisions with regards to the structure of the final models were based on preliminary analyses conducted in the unimputed data.
We specified linear mixed models to analyse associations of SCB intake during pregnancy with trajectories of children’s BMI between one month and six years of age. To explore these associations, we constructed three models with a fixed-effects structure that included maternal SCB intake and possible confounders, and a random-effects structure that included a random intercept and slope (for age). In Model 1 (crude model), we adjusted for child sex and further included energy intake in the model. Model 2 (confounder model) was additionally adjusted for the following covariates: maternal parity, age, gestational age at enrolment, marital status, income, education, psychiatric symptoms during pregnancy, protein intake (percentage of energy intake), diet quality, smoking during pregnancy, alcohol intake during pregnancy, use of folic acid supplements, and child sports and screen times. The confounders were selected on the basis of previous literature and a \(\geq\) 10% change in effect estimates (Mickey and Greenland 1989). In Model 3 (SCB child model), we adjusted for child SCB intake at age six years in addition to the confounders used in Model 2 (Leermakers et al. 2015). We investigated non-linearity of trajectories of children’s BMI over time and potential effect modification of the trajectories by SCB intake using natural cubic splines for age and an interaction term between the spline and SCB intake. Based on this preliminary analysis there was no evidence for the need of either non-linear trajectories or the interaction term and the simpler model assuming linear trajectories and associations was used in the final analysis.
In addition, we specified linear regression models to examine the association between intake of SCBs during pregnancy and children’s FMI and FFMI at age six years. We used the previously mentioned Models 2 and 3 to which we further added child age at the six-year visit. The analyses for BMI trajectories, FMI, and FFMI were modelled jointly in the Bayesian analysis.
Intake of SCBs was examined both with and without energy adjustment. Adjustment for energy intake was performed using the residual method (Willett, Howe, and Kushi 1997). We report results from energy-adjusted SCBs as the main results in this study. To study whether the associations differed by the type of SCB, the analyses were repeated for intakes of fruit juice, concentrate, and soda instead of total SCB intake.
For relevant associations (i.e., when the 95% CI excluded zero in Model 3), we also examined the role of the potential mediators gestational weight gain, child birth weight, maternal BMI at enrolment (Kalk et al. 2009), and child serum insulin concentrations at six years of age (Reichetzeder et al. 2016) by including them in the model. These analyses were performed in the multiply imputed data obtained from the Bayesian model. Moreover, we tested whether associations were modified by child sex (Reichetzeder et al. 2016) or by maternal BMI at enrolment by adding the product term of the potential effect modifier and maternal SCB intake to Models 1 and 2 and re-evaluating them in the imputed data. Main analyses were stratified if the pooled estimate of the interaction term was significantly different from zero.
To test the robustness of our findings, we performed two sensitivity analyses based on the imputed data. First, we repeated our analyses by restricting them to women who vomited less than one time per week because vomiting in pregnancy may alter dietary intake (Chortatos et al. 2013). Second, we restricted analyses to women who did not experience comorbidities during pregnancy (i.e., diabetes mellitus, gestational diabetes, or hypertensive disorders) because these comorbidities could alter the maternal diet during pregnancy and may affect child birth weight (Hutcheon, Lisonkova, and Joseph 2011; Boerschmann et al. 2010). All statistical analyses were performed with the use of SPSS 21.0 (IBM Corp.), R version 3.3.1 (R Core Team 2016), and JAGS (version 4.2.0; )(Plummer 2003).
4.4 Results
4.4.1 Subject Characteristics
Characteristics of the 3312 mothers and their children included in this study are presented in Table 4.1. Median intake of total SCBs during pregnancy was 1.9 servings/day (2.5% and 97.5% quantiles: 0.1 and 7.4 servings/day). Most intake came from fruit juices, with a median intake of 1.0 serving/day (2.5% and 97.5% quantiles: 0.0 and 5.0 servings/day), whereas for both concentrate (2.5% and 97.5% quantiles: 0.0 and 4.5 servings/day) and soda (2.5% and 97.5% quantiles: 0.0 and 2.5 servings/day) median intake was only 0.1 serving/day. Most of the women who were included were highly educated (60.7%), had never smoked during pregnancy (75.2%), and used folic acid supplementation during pregnancy (88.8%). The mean ± SD birth weight of the children was 3488 ± 561 gram. At six years of age, median BMI of the children was 15.7 (2.5% and 97.5% quantiles: 13.7 and 19.3) with 9.2% of the children being classified as overweight or obese.
| Maternal Characteristics during Pregnancy | |
| age at enrolment in years | 31.6 \(\pm\) 4.3 |
| BMI at enrolment in kg/m2 | 23.4 (18.9, 35.1) |
| nulliparous, % | 59.9 |
| gestational age at enrolment in weeks | 13.4 (9.8, 22.8) |
| gestational weight gain in kg | 8.1 \(\pm\) 3.5 |
| educational level, higher, % | 60.7 |
| net household income \(\geq\) € 2400/month, % | 80.8 |
| alcohol consumption, % | |
| never | 31.0 |
| until pregnancy was known | 16.0 |
| occasionally during pregnancy | 40.6 |
| frequently during pregnancy | 12.4 |
| smoking, % | |
| never | 75.2 |
| until pregnancy was known | 9.1 |
| continued during pregnancy | 15.6 |
| folic acid supplementation, % | |
| never | 11.2 |
| until pregnancy was known | 54.6 |
| started in the first 10 weeks | 34.2 |
| total energy intake in kcal/day | 2148 \(\pm\) 506 |
| sugar-containing beverages in servings/day | |
| total | 1.9 (0.1, 7.4) |
| fruit juice (57.2%) | 1.0 (0.0, 5.0) |
| concentrate (27.6%) | 0.1 (0.0, 4.5) |
| soda (15.1%) | 0.1 (0.0, 2.5) |
| Child Characteristics at Birth | |
| girls, % | 49.6 |
| birth weight in gram | 3488 \(\pm\) 561 |
| gestational age at birth in weeks | 13.4 (9.8, 22.8) |
| Child Characteristics at 6-year Visit (n = 2736) | |
| age in years | 6.0 (5.6, 7.3) |
| BMI in kg/m2 | 15.7 (13.7, 19.3) |
| overweight or obese, % | 9.2 |
| Fat Mass Index in kg/m2 (n = 2660) | 3.6 (2.4, 6.7) |
| Fat-Free Mass Index in kg/m2 (n = 2660) | 11.9 \(\pm\) 0.8 |
| participation in sports, % (n = 3312) | 50.6 |
| screen time \(\geq\) 2 hours/day, % (n = 3312) | 21.3 |
4.4.2 Maternal SCB Intake and Child BMI Trajectory
In the linear mixed-model analyses, we observed no relevant associations between energy-adjusted SCB intake during pregnancy and BMI trajectories of children from birth to six years of age in Model 1 (0.01 SD score (SDS); 95% CI: [-0.02, 0.04]) and Model 2 (0.03 SDS; 95% CI [0.00, 0.07]; Table 4.2). After adjustment for child SCB intake, we observed that higher SCB intake during pregnancy was associated with higher BMI of children (Model 3: 0.04 SDS; 95% CI [0.00, 0.07]). This association was not explained by specific intakes of fruit juice, concentrate, or soda during pregnancy.
| Model 1 (crude) | Model 2 (confounder) | Model 3 (SCB child) | |
|---|---|---|---|
| total, servings per day | |||
| total SCB | 0.01 [-0.02, 0.04] | 0.03 [-0.00, 0.07] | 0.04 [ 0.00, 0.07] |
| fruit juice, soda and concentrate, servings per day | |||
| fruit juice | 0.01 [-0.02, 0.03] | 0.02 [-0.01, 0.04] | 0.02 [-0.01, 0.04] |
| soda | -0.01 [-0.02, 0.01] | 0.00 [-0.02, 0.02] | 0.00 [-0.01, 0.02] |
| concentrate | 0.00 [-0.02, 0.02] | 0.00 [-0.01, 0.02] | 0.00 [-0.01, 0.02] |
4.4.3 Maternal SCB Intake and Child Body Composition
In the linear regression analyses, we found in Model 1 that one additional daily serving of SCBs during pregnancy was associated with a 0.05-SDS higher FMI (95% CI [0.02, 0.09]) but not with FFMI of the offspring at age six years (Tables 4.3 and 4.4). This association remained after further adjustment for sociodemographic and lifestyle factors (Model 2: 0.04 SDS, 95% CI [0.01, 0.07]; Model 3: 0.05 SDS, 95% CI [0.01, 0.08]). To study fruit juice, concentrate, and soda intakes as exposures, we replaced total SCB intake for these types of beverages in the analyses. We observed an association between a higher daily serving of fruit juice, but not of concentrate or soda, during pregnancy and higher FMI (Model 3: 0.04 SDS, 95% CI [0.01, 0.06]; Table 4.3) but not higher FFMI (Model 3: 0.02 SDS, 95% CI [-0.01, 0.05]; Table 4.4). These effect estimates remained similar after adjustment for the potential mediators gestational weight gain, child birth weight, maternal BMI at enrolment, and child insulin concentrations (Table 4.5 in Appendix 4.A).
| Model 1 (crude) | Model 2 (confounder) | Model 3 (SCB child) | |
|---|---|---|---|
| total, servings per day | |||
| total SCB | 0.05 [ 0.02, 0.09] | 0.04 [ 0.01, 0.07] | 0.05 [ 0.01, 0.08] |
| fruit juice, soda and concentrate, servings per day | |||
| juice | 0.03 [ 0.00, 0.06] | 0.03 [ 0.01, 0.06] | 0.04 [ 0.01, 0.06] |
| soda | 0.02 [ 0.00, 0.03] | -0.01 [-0.02, 0.01] | -0.01 [-0.02, 0.01] |
| concentrate | -0.02 [-0.04, -0.00] | -0.02 [-0.03, 0.00] | -0.02 [-0.03, 0.00] |
| Model 1 (crude) | Model 2 (confounder) | Model 3 (SCB child) | |
|---|---|---|---|
| total, servings per day | |||
| total SCB | -0.01 [-0.05, 0.03] | 0.03 [-0.02, 0.07] | 0.03 [-0.01, 0.07] |
| fruit juice, soda and concentrate, servings per day | |||
| juice | 0.01 [-0.02, 0.04] | 0.02 [-0.01, 0.05] | 0.02 [-0.01, 0.05] |
| soda | -0.02 [-0.04, -0.00] | -0.00 [-0.02, 0.02] | -0.02 [-0.02, 0.02] |
| concentrate | 0.01 [-0.01, 0.03] | 0.01 [-0.01, 0.03] | 0.01 [-0.01, 0.03] |
4.4.4 Additional Analyses
We did not observe interactions between SCB intake and maternal BMI for children’s BMI, FMI, or FFMI and consequently our analyses were not stratified by this factor. We did observe an interaction of total SCB and fruit juice intake with child sex on children’s FMI but not on BMI or FFMI. Therefore, we stratified analyses for FMI by sex, and we observed higher effect estimates in girls than in boys. In addition, we observed no association between SCB intake and FMI in boys (Table 4.6 in Appendix 4.A). Furthermore, we obtained similar effect estimates as were observed in the whole group after restricting our analyses to women who vomited less than one time per week (n = 2099) (Tables 4.7 and 4.8 in Appendix 4.A) or to women with no comorbidities during pregnancy (n = 2308) (Tables 4.9 and 4.10 in Appendix 4.A). Findings for SCB intake that was unadjusted for total energy intake were similar to those obtained for energy-adjusted SCBs (data not shown).
4.5 Discussion
The results of this longitudinal observational study suggest that higher intake of SCBs during pregnancy is associated with higher BMI of the child until six years of age. Furthermore, we observed that higher SCB intakes of mothers were associated with higher fat masses, but not higher fat-free masses, of their children, particularly in girls, and that this association was mainly explained by intake of fruit juice. These associations were independent of gestational weight gain, birth weight, child SCB intake, or child insulin concentration.
4.5.1 Interpretation and Comparison with Previous Studies
In our study population, intake of SCBs during pregnancy was associated with trajectories of BMI in children during early childhood. This result is not in line with that of the previously mentioned study that was performed by Phelan et al. (2011) in which they observed that intakes of soft drinks and fruit juice in 285 pregnant women were not associated with birth weight or weight after 6 months of age. However, our findings suggest an association between maternal SCB intake and children’s BMI at a later age, which was not explained by a higher birth weight, thereby suggesting that an effect may be stronger later in childhood. Furthermore, BMI has several limitations as a marker of adiposity in children (Freedman et al. 2005). First, BMI does not measure excess fat mass because of the many combinations of FMI and FFMI that result in the same BMI. Second, the amounts of both fat mass and fat-free mass vary within children (Freedman et al. 2005). In our study population, we observed that higher intake of SCBs during pregnancy was associated with higher FMI, but not higher FFMI, of children at six years of age. This finding is in line with results from previous studies that have studied SCB intakes in children and the body compositions of these children (Zheng et al. 2015, 2014; Ruyter et al. 2012).
Moreover, we observed associations between maternal intake of fruit juice, but not of other beverages, and higher FMI of their six-year-old children. In our study population, intake of fruit juice was 10 times higher (median: 1.0 serving per day) than intakes of concentrate and soda. Consequently, intakes of concentrate and soda in our study may have been too low to detect potential associations with adverse body-composition outcomes of the children. Although fruit juice also provides vitamins and minerals (Caswell 2009), our results suggest that fruit juice could be harmful for a child’s body composition.
For FMI, but not for the other outcomes, we observed stronger associations in girls than in boys. We previously also observed stronger associations of early life nutrition with body fat in girls than in boys at approximately six years of age (Leermakers et al. 2015; Voortman, Braun, et al. 2016). These associations have been suggested to be related to differences in insulin responses between boys and girls (Voortman, van den Hooven, et al. 2016) or to differences in the timing of the adiposity rebound, which usually occurs between the ages of five and seven years (Rolland-Cachera et al. 2006).
4.5.2 Potential Mechanisms
We observed that SCB intake during pregnancy was positively associated with child BMI and FMI during early childhood. One possible mechanism that may explain this relation could be excessive energy intake from the SCBs themselves or from other food sources because caloric intake in a liquid form leads to a lower and shorter feeling of satiation (Pan and Hu 2011; Cassady, Considine, and Mattes 2012; Drewnowski and Bellisle 2007; DiMeglio and Mattes 2000). However, in our analyses, effect estimates were similar after adjustment for energy intake, and associations remained between SCB intake and child BMI and FMI, which suggested that the associations were due to other factors than energy intake.
Another possible mechanism could be that the epigenetics of the fetus changes when a mother has frequent intake of SCBs during pregnancy (Mateo-Fernández et al. 2016). These changes could lead to altered gene expression (De Boo and Harding 2006), which may result in children becoming more susceptible to having higher fat mass.
Furthermore, because SCB intake leads to high peak concentration of insulin (Hu and Malik 2010), the role of insulin should be further elucidated. Hyperinsulinemia during the development of the fetus could have long-lasting consequences to the central nervous systems that regulates body weight, possibly resulting in the stimulation of fat mass development (Franke et al. 2005). In addition, SCB intake during pregnancy might affect the insulin sensitivity of the child (Reichetzeder et al. 2016) with the subsequent stimulation of the development of fat mass in the child. However, our findings suggest that a child’s insulin concentration is not part of this pathway. Unfortunately, we had no information available on serum insulin during pregnancy.
Our results could also be explained by residual confounding because intake of SCBs is associated with other lifestyle factors (Kvaavik, Andersen, and Klepp 2005). Although we had information available on several potential lifestyle confounders, including smoking, alcohol intake, and the overall diet quality during pregnancy, we had, for instance, no information on the physical activity of the mother (Schulze et al. 2004). Furthermore, confounding that could have been due to child factors is difficult to take into account because lifestyle patterns may change during childhood (Lytle et al. 2000). As part of these lifestyle patterns, intake of sweet foods, including SCBs, by the child could have partially determined the child’s body composition. Prenatal exposures such as flavours of the maternal diet can transmit to the amniotic fluid, which consequently may lead to greater acceptance by the child of these foods after birth (Mennella, Johnson, and Beauchamp 1995). We attempted to take this potential confounding by child diet into account by adjusting for SCB intake of the child, and the association between SCB intake of the mother with her offspring’s fat mass remained.
4.5.3 Strengths and Limitations
Strengths of this study are the prospective population-based design, the large sample size, and the available information on numerous confounders of the mothers and children. Additionally, the repeated measurement of child BMI was an important strength in this study. Furthermore, we had extensive measurements on child body composition at six years of age with the use of DXA. This method has been proven to measure fat mass accurately (Svendsen et al. 1993), which allowed us to distinguish the child’s body fat mass and fat-free mass. Another strength is that we also studied different types of SCBs rather than only examining overall intake. Finally, we applied the Bayesian approach which allowed us to use all available information of the outcome measurements to impute missing covariate values. The use of this approach provides a better method to deal with bias that is associated with incomplete information on covariates than is achieved with the use of less-sophisticated missing-data methods (Erler et al. 2016).
This study also has several limitations. One limitation is that dietary intakes were estimated by self-report, which has been shown to be prone to measurement errors (Kipnis et al. 2003b). However, we reduced the magnitude of the measurement errors by adjusting for total energy intake with the use of the residual method. Because all mothers included in our analyses were of Dutch origin and were, on average, highly educated, the generalizability of our findings to other ethnic or socioeconomic groups may be limited. Another limitation may be the single assessment of SCB intake during the first trimester. Repeated measurements of dietary intake would have been better to study whether there may have been an accumulative or trimester-specific effect of maternal SCB intake on child BMI and body composition. Although we adjusted the analyses for numerous sociodemographic and lifestyle factors related to both mother and child, residual confounding was still possible. An example was the absence of information on the energy expenditure or physical activity of the mother (Dewey and McCrory 1994) or on the diet of the father (Li et al. 2016), which might have influenced our results. Finally, although we had information that was available on total SCB intake of the child at six years, we did not collect information on different types of SCB intake, total energy intake, or other components of the diet of the child.
In conclusion, in this prospective cohort, we observe that higher intake of SCBs during pregnancy is associated with higher child BMI until six years of age. Moreover, higher intakes of total SCBs and fruit juice, but not of soda or concentrate, are associated with higher FMI of the child at six years of age. These associations are stronger in girls than in boys. Future studies should further explore whether SCB intake during pregnancy is associated with child body composition, which should preferably be assessed repeatedly to observe whether changes occur in later stages during childhood.
Appendix
4.A Additional Results
| total, servings per day | ||
| Model 3 | \(+\) gestational weight gain | 0.04 [0.01, 0.08] |
| Model 3 | \(+\) birth weight \(z\)-score | 0.04 [0.01, 0.08] |
| Model 3 | \(+\) maternal baseline BMI | 0.04 [0.00, 0.07] |
| Model 3 | \(+\) child insulin at six years | 0.05 [0.00, 0.09] |
| Model 3 | \(+\) gestational weight gain \(+\) birth weight \(z\)-scores \(+\) maternal BMI at enrolment \(+\) child insulin | 0.04 [0.00, 0.08] |
| fruit juice, servings per day | ||
| Model 3 | \(+\) gestational weight gain | 0.04 [0.01, 0.06] |
| Model 3 | \(+\) birth weight \(z\)-score | 0.03 [0.01, 0.06] |
| Model 3 | \(+\) maternal baseline BMI | 0.03 [0.00, 0.06] |
| Model 3 | \(+\) child insulin at six years | 0.04 [0.01, 0.07] |
| Model 3 | \(+\) gestational weight gain \(+\) birth weight \(z\)-scores \(+\) maternal baseline BMI \(+\) child insulin | 0.03 [0.00, 0.06] |
| total, servings per day | |||
| Model 3 (SCB child) | 0.05 [0.01, 0.08] | 0.09 [0.05, 0.14] | -0.01 [-0.06, 0.04] |
| fruit juice, servings per day | |||
| Model 3 (SCB child) | 0.04 [0.01, 0.06] | 0.04 [0.01, 0.08] | 0.03 [-0.01, 0.06] |
| Model 1 (crude) | Model 2 (confounder) | Model 3 (SCB child) | |
|---|---|---|---|
| total, servings per day | |||
| total SCB | 0.05 [ 0.01, 0.09] | 0.04 [-0.00, 0.08] | 0.04 [ 0.00, 0.08] |
| fruit juice, soda and concentrate, servings per day | |||
| juice | 0.03 [ 0.00, 0.06] | 0.03 [ 0.00, 0.06] | 0.04 [ 0.01, 0.06] |
| soda | 0.01 [-0.01, 0.03] | -0.01 [-0.03, 0.01] | -0.01 [-0.03, 0.01] |
| concentrate | -0.01 [-0.03, 0.01] | -0.01 [-0.03, 0.01] | -0.01 [-0.03, 0.01] |
| Model 1 (crude) | Model 2 (confounder) | Model 3 (SCB child) | |
|---|---|---|---|
| total, servings per day | |||
| total SCB | -0.02 [-0.07, 0.03] | 0.01 [-0.04, 0.06] | 0.02 [-0.03, 0.06] |
| fruit juice, soda and concentrate, servings per day | |||
| juice | 0.01 [-0.03, 0.04] | 0.01 [-0.02, 0.05] | 0.01 [-0.02, 0.05] |
| soda | -0.03 [-0.05, -0.01] | -0.01 [-0.03, 0.02] | -0.01 [-0.03, 0.02] |
| concentrate | 0.01 [-0.01, 0.04] | 0.02 [-0.01, 0.04] | 0.02 [-0.01, 0.04] |
| Model 1 (crude) | Model 2 (confounder) | Model 3 (SCB child) | |
|---|---|---|---|
| total, servings per day | |||
| total SCB | 0.05 [ 0.02, 0.09] | 0.03 [ 0.00, 0.07] | 0.04 [ 0.01, 0.07] |
| fruit juice, soda and concentrate, servings per day | |||
| fruit juice | 0.03 [ 0.01, 0.06] | 0.04 [ 0.01, 0.06] | 0.04 [ 0.01, 0.07] |
| soda | 0.01 [ 0.00, 0.03] | -0.01 [-0.03, 0.01] | -0.01 [-0.03, 0.01] |
| concentrate | -0.02 [-0.03, 0.00] | -0.01 [-0.03, 0.00] | -0.01 [-0.03, 0.00] |
| Model 1 (crude) | Model 2 (confounder) | Model 3 (SCB child) | |
|---|---|---|---|
| total, servings per day | |||
| total SCB | -0.01 [-0.06, 0.03] | 0.02 [-0.03, 0.06] | 0.02 [-0.02, 0.07] |
| fruit juice, soda and concentrate, servings per day | |||
| fruit juice | 0.01 [-0.02, 0.05] | 0.02 [-0.01, 0.05] | 0.01 [-0.02, 0.04] |
| soda | -0.03 [-0.05, -0.01] | -0.01 [-0.04, 0.01] | -0.01 [-0.04, 0.01] |
| concentrate | 0.01 [-0.01, 0.03] | 0.01 [-0.01, 0.04] | 0.00 [-0.01, 0.04] |
References
Batch, Jennifer A., and Louise A. Baur. 2005. “Management and Prevention of Obesity and Its Complications in Children and Adolescents.” The Medical Journal of Australia 182 (3): 130–5.
Boerschmann, Heike, Maren Pflüger, Lydia Henneberger, Anette-G. Ziegler, and Sandra Hummel. 2010. “Prevalence and Predictors of Overweight and Insulin Resistance in Offspring of Mothers with Gestational Diabetes Mellitus.” Diabetes Care. https://doi.org/10.2337/dc10-0139.
Cassady, Bridget A., Robert V. Considine, and Richard D. Mattes. 2012. “Beverage Consumption, Appetite, and Energy Intake: What Did You Expect?” The American Journal of Clinical Nutrition 95 (3): 587–93. https://doi.org/10.3945/ajcn.111.025437.
Caswell, Heather. 2009. “The Role of Fruit Juice in the Diet: An Overview.” Nutrition Bulletin 34 (3): 273–88. https://doi.org/10.1111/j.1467-3010.2009.01760.x.
Chortatos, A., M. Haugen, P. O. Iversen, Å. Vikanes, P. Magnus, and M. B. Veierød. 2013. “Nausea and vomiting in pregnancy: associations with maternal gestational diet and lifestyle factors in the Norwegian Mother and Child Cohort Study.” BJOG: An International Journal of Obstetrics & Gynaecology 120 (13): 1642–53. https://doi.org/10.1111/1471-0528.12406.
Cole, Tim J., Mary C. Bellizzi, Katherine M. Flegal, and William Hm Dietz. 2000. “Establishing a Standard Definition for Child Overweight and Obesity Worldwide: International Survey.” BMJ 320 (7244): 1240. https://doi.org/10.1136/bmj.320.7244.1240.
Coolman, Marianne, Christianne J. M. de Groot, Vincent W. V. Jaddoe, Albert Hofman, Hein Raat, and Eric A. P. Steegers. 2010. “Medical Record Validation of Maternally Reported History of Preeclampsia.” Journal of Clinical Epidemiology 63 (8): 932–37. https://doi.org/10.1016/j.jclinepi.2009.10.010.
De Boo, Hendrina A, and Jane E Harding. 2006. “The Developmental Origins of Adult Disease (Barker) Hypothesis.” Australian and New Zealand Journal of Obstetrics and Gynaecology 46 (1): 4–14. https://doi.org/10.1111/j.1479-828X.2006.00506.x.
Derogatis, Leonard R., and Nick Melisaratos. 1983. “The Brief Symptom Inventory: an introductory report.” Psychological Medicine 13 (3): 595–605. https://doi.org/10.1017/S0033291700048017.
Dewey, Kathryn G., and Megan A. McCrory. 1994. “Effects of Dieting and Physical Activity on Pregnancy and Lactation.” The American Journal of Clinical Nutrition 59 (2): 446S–453S. https://doi.org/10.1093/ajcn/59.2.446S.
DiMeglio, Doreen P., and Richard D. Mattes. 2000. “Liquid Versus Solid Carbohydrate: Effects on Food Intake and Body Weight.” International Journal of Obesity 24 (6): 794. https://doi.org/10.1038/sj.ijo.0801229.
Drewnowski, Adam, and France Bellisle. 2007. “Liquid Calories, Sugar, and Body Weight.” The American Journal of Clinical Nutrition 85 (3): 651–61. https://doi.org/10.1093/ajcn/85.3.651.
Erler, Nicole S., Dimitris Rizopoulos, Joost van Rosmalen, Vincent W. V. Jaddoe, Oscar H. Franco, and Emmanuel M. E. H. Lesaffre. 2016. “Dealing with Missing Covariates in Epidemiologic Studies: A Comparison Between Multiple Imputation and a Full Bayesian Approach.” Statistics in Medicine 35 (17): 2955–74. https://doi.org/10.1002/sim.6944.
Franke, Kerstin, Thomas Harder, Leona Aerts, Kerstin Melchior, Sonja Fahrenkrog, Elke Rodekamp, Thomas Ziska, F André Van Assche, Joachim W. Dudenhausen, and Andreas Plagemann. 2005. “‘Programming’of Orexigenic and Anorexigenic Hypothalamic Neurons in Offspring of Treated and Untreated Diabetic Mother Rats.” Brain Research 1031 (2): 276–83. https://doi.org/10.1016/j.brainres.2004.11.006.
Freedman, David S., Jack Wang, L. Michele Maynard, John C. Thornton, Zuguo Mei, Richard N. Pierson Jr., William H. Dietz, and Mary Horlick. 2005. “Relation of BMI to fat and fat-free mass among children and adolescents.” International Journal of Obesity 29 (1): 1–8. https://doi.org/10.1038/sj.ijo.0802735.
Hu, Frank B., and Vasanti S. Malik. 2010. “Sugar-sweetened beverages and risk of obesity and type 2 diabetes: Epidemiologic evidence.” Physiology & Behavior 100 (1): 47–54. https://doi.org/10.1016/j.physbeh.2010.01.036.
Hutcheon, Jennifer A., Sarka Lisonkova, and K. S. Joseph. 2011. “Epidemiology of Pre-Eclampsia and the Other Hypertensive Disorders of Pregnancy.” Best Practice & Research Clinical Obstetrics & Gynaecology 25 (4): 391–403. https://doi.org/10.1016/j.bpobgyn.2011.01.006.
Kalk, P., F. Guthmann, K. Krause, K. Relle, M. Godes, G. Gossing, H. Halle, R. Wauer, and B. Hocher. 2009. “Impact of Maternal Body Mass Index on Neonatal Outcome.” European Journal of Medical Research 14 (5): 216. https://doi.org/10.1186/2047-783X-14-5-216.
Kipnis, Victor, Amy F. 2003b. “Structure of Dietary Measurement Error: Results of the Open Biomarker Study.” American Journal of Epidemiology 158 (1): 14–21. https://doi.org/10.1093/aje/kwg091.
Klipstein-Grobusch, Kerstin, J. H. den Breeijen, R. A. Goldbohm, J. M. Geleijnse, A. Hofman, D. E. Grobbee, and J. C. M. Witteman. 1998. “Dietary Assessment in the Elderly: Validation of a Semiquantitative Food Frequency Questionnaire.” European Journal of Clinical Nutrition 52 (8): 588–96. https://doi.org/10.1038/sj.ejcn.1600611.
Kooijman, Marjolein N., Claudia J. Kruithof, Cornelia M. van Duijn, Liesbeth Duijts, Oscar H. Franco, Marinus H. van IJzendoorn, Johan C. de Jongste, et al. 2016. “The Generation R Study: Design and Cohort Update 2017.” European Journal of Epidemiology 31 (12): 1243–64. https://doi.org/10.1007/s10654-016-0224-9.
Krebs, Nancy F., and Marc S. Jacobson. 2003. “Prevention of Pediatric Overweight and Obesity.” Pediatrics 112 (2): 424–30. https://doi.org/10.1542/peds.112.2.424.
Kvaavik, Elisabeth, Lene Frost Andersen, and Knut-Inge Klepp. 2005. “The Stability of Soft Drinks Intake from Adolescence to Adult Age and the Association Between Long-Term Consumption of Soft Drinks and Lifestyle Factors and Body Weight.” Public Health Nutrition 8 (2): 149–57. https://doi.org/10.1079/PHN2004669.
Leermakers, Elisabeth T. M., Janine F. Felix, Nicole S. Erler, A. Ćerimagić, A. I. Wijtzes, Albert Hofman, Hein Raat, et al. 2015. “Sugar-containing beverage intake in toddlers and body composition up to age 6 years: The Generation R Study.” European Journal of Clinical Nutrition 69 (3): 314. https://doi.org/10.1038/ejcn.2015.2.
Li, Jian, Oleg Tsuprykov, Xiaoping Yang, and Berthold Hocher. 2016. “Paternal Programming of Offspring Cardiometabolic Diseases in Later Life.” Journal of Hypertension 34 (11): 2111. https://doi.org/10.1097/HJH.0000000000001051.
Lytle, Leslie A., Sara Seifert, Jessica Greenstein, and Paul McGovern. 2000. “How Do Children’s Eating Patterns and Food Choices Change over Time? Results from a Cohort Study.” American Journal of Health Promotion 14 (4): 222–28. https://doi.org/10.4278/0890-1171-14.4.222.
Malik, Vasanti S., Barry M. Popkin, George A. Bray, Jean-Pierre Després, and Frank B. Hu. 2010. “Sugar-Sweetened Beverages, Obesity, Type 2 Diabetes Mellitus, and Cardiovascular Disease Risk.” Circulation 121 (11): 1356–64. https://doi.org/10.1161/CIRCULATIONAHA.109.876185.
Malik, Vasanti S., Matthias B. Schulze, and Frank B. Hu. 2006. “Intake of Sugar-Sweetened Beverages and Weight Gain: A Systematic Review.” The American Journal of Clinical Nutrition 84 (2): 274–88. https://doi.org/10.1093/ajcn/84.2.274.
Mateo-Fernández, Marcos, Tania Merinas-Amo, Miguel Moreno-Millán, Ángeles Alonso-Moraga, and Sebastián Demyda-Peyrás. 2016. “In Vivo and In Vitro Genotoxic and Epigenetic Effects of Two Types of Cola Beverages and Caffeine: A Multiassay Approach.” BioMed Research International 2016. https://doi.org/10.1155/2016/7574843.
Mennella, Julie A, Anthony Johnson, and Gary K Beauchamp. 1995. “Garlic Ingestion by Pregnant Women Alters the Odor of Amniotic Fluid.” Chemical Senses 20 (2): 207–9. https://doi.org/10.1093/chemse/20.2.207.
Mickey, Ruth M., and Sander Greenland. 1989. “The Impact of Confounder Selection Criteria on Effect Estimation.” American Journal of Epidemiology 129 (1): 125–37. https://doi.org/10.1093/oxfordjournals.aje.a115101.
Netherlands Nutrition Center. 2006. “Nevo: Dutch Food Composition Database 2006.” The Hague, the Netherlands: Netherlands Nutrition Centre.
Nguyen, Anh N., Lisanne M. de Barse, Henning Tiemeier, Vincent W. V. Jaddoe, Oscar H. Franco, Pauline W. Jansen, and Trudy Voortman. 2017. “Maternal history of eating disorders: Diet quality during pregnancy and infant feeding.” Appetite 109: 108–14. https://doi.org/10.1016/j.appet.2016.11.030.
Niklasson, A., A. Ericson, J. G. Fryer, J. Karlberg, C. Lawrence, and P. Karlberg. 1991. “An Update of the Swedish Reference Standards for Weight, Length and Head Circumference at Birth for Given Gestational Age (1977‐1981).” Acta Paediatrica 80 (8-9): 756–62. https://doi.org/10.1111/j.1651-2227.1991.tb11945.x.
Pan, An, and Frank B. Hu. 2011. “Effects of Carbohydrates on Satiety: Differences Between Liquid and Solid Food.” Current Opinion in Clinical Nutrition & Metabolic Care 14 (4): 385–90. https://doi.org/10.1097/MCO.0b013e328346df36.
Phelan, Suzanne, Chantelle Hart, Maureen Phipps, Barbara Abrams, Andrew Schaffner, Angelica Adams, and Rena Wing. 2011. “Maternal Behaviors during Pregnancy Impact Offspring Obesity Risk.” Experimental Diabetes Research 2011. https://doi.org/10.1155/2011/985139.
Plummer, M. 2003. “JAGS: A Program for Analysis of Bayesian Graphical Models Using Gibbs Sampling.” Edited by Kurt Hornik, Friedrich Leisch, and Achim Zeileis.
Raben, Anne, Tatjana H. Vasilaras, A. Christina Møller, and Arne Astrup. 2002. “Sucrose Compared with Artificial Sweeteners: Different Effects on Ad Libitum Food Intake and Body Weight After 10 Wk of Supplementation in Overweight Subjects.” The American Journal of Clinical Nutrition 76 (4): 721–29. https://doi.org/10.1093/ajcn/76.4.721.
R Core Team. 2016. R: A Language and Environment for Statistical Computing. Vienna, Austria: R Foundation for Statistical Computing. http://www.R-project.org/.
Reichetzeder, Christoph, Sulistyo Emantoko Dwi Putra, Jian Li, and Berthold Hocher. 2016. “Developmental Origins of Disease – Crisis Precipitates Change.” Cellular Physiology and Biochemistry 39 (3): 919–38. https://doi.org/10.1159/000447801.
Rolland-Cachera, M. F., M. Deheeger, M. Maillot, and F. Bellisle. 2006. “Early Adiposity Rebound: Causes and Consequences for Obesity in Children and Adults.” International Journal of Obesity 30 (S4): S11. https://doi.org/10.1038/sj.ijo.0803514.
Ruyter, Janne C. de, Margreet R. Olthof, Jacob C. Seidell, and Martijn B. Katan. 2012. “A Trial of Sugar-free or Sugar-Sweetened Beverages and Body Weight in Children.” New England Journal of Medicine 367 (15): 1397–1406. https://doi.org/10.1056/NEJMoa1203034.
Schulze, Matthias B., JoAnn E. Manson, David S. Ludwig, Graham A. Colditz, Meir J. Stampfer, Walter C. Willett, and Frank B. Hu. 2004. “Sugar-Sweetened Beverages, Weight Gain, and Incidence of Type 2 Diabetes in Young and Middle-Aged Women.” JAMA 292 (8): 927–34. https://doi.org/10.1001/jama.292.8.927.
Statistics Netherlands. 2003. “Standaard Onderwijsindeling 2003.” Den Haag/Heerlen (Netherlands): Statistics Netherlands.
Svendsen, Ole Lander, Jens Haarbo, Christian Hassager, and Clans Christiansen. 1993. “Accuracy of Measurements of Body Composition by Dual-Energy X-Ray Absorptiometry in Vivo.” The American Journal of Clinical Nutrition 57 (5): 605–8. https://doi.org/10.1093/ajcn/57.5.605.
Tordoff, Michael G., and Annette M. Alleva. 1990. “Effect of Drinking Soda Sweetened with Aspartame or High-Fructose Corn Syrup on Food Intake and Body Weight.” The American Journal of Clinical Nutrition 51 (6): 963–69. https://doi.org/10.1093/ajcn/51.6.963.
Voortman, Trudy, K. V. E. Braun, J. C. Kiefte-de Jong, Vincent W. V. Jaddoe, O. H. Franco, and E. H. van den Hooven. 2016. “Protein intake in early childhood and body composition at the age of 6 years: The Generation R Study.” International Journal of Obesity 40 (6). https://doi.org/10.1038/ijo.2016.29.
Voortman, Trudy, Edith H. van den Hooven, Myrte J. Tielemans, Albert Hofman, Jessica C. Kiefte-de Jong, Vincent W. V. Jaddoe, and Oscar H. Franco. 2016. “Protein intake in early childhood and cardiometabolic health at school age: the Generation R Study.” European Journal of Nutrition 55 (6): 2117–27. https://doi.org/10.1007/s00394-015-1026-7.
Willett, Walter C., Geoffrey R. Howe, and Lawrence H. Kushi. 1997. “Adjustment for Total Energy Intake in Epidemiologic Studies.” The American Journal of Clinical Nutrition 65 (4): 1220S–1228S. https://doi.org/10.1093/ajcn/65.4.1220S.
Zheng, Miaobing, Anna Rangan, Nanna Julie Olsen, Lars Bo Andersen, Niels Wedderkopp, Peter Kristensen, Anders Grøntved, et al. 2015. “Substituting Sugar-Sweetened Beverages with Water or Milk Is Inversely Associated with Body Fatness Development from Childhood to Adolescence.” Nutrition 31 (1): 38–44. https://doi.org/10.1016/j.nut.2014.04.017.
Zheng, Miaobing, Anna Rangan, Nanna Julie Olsen, L. Bo Andersen, Niels Wedderkopp, Peter Kristensen, Anders Grøntved, et al. 2014. “Sugar-sweetened beverages consumption in relation to changes in body fatness over 6 and 12 years among 9-year-old children: the European Youth Heart Study.” European Journal of Clinical Nutrition 68 (1): 77. https://doi.org/10.1038/ejcn.2013.243.