Chapter 3 Dietary Patterns and Gestational Weight Gain
This chapter is based on
Myrte J. Tielemans, Nicole S. Erler, Elisabeth T.M. Leermakers, Marion van den Broek, Vincent W.V. Jaddoe, Eric A.P. Steegers, Jessica C. Kiefte-de Jong and Oscar H. Franco. A priori and a posteriori dietary patterns during pregnancy and gestational weight gain: The Generation R Study. Nutrients, 2015; 7(11), 9383–9399. doi:10.3390/nu7115476
Abstract
Abnormal gestational weight gain (GWG) is associated with adverse pregnancy outcomes. We examined whether dietary patterns are associated with GWG in 3374 pregnant women participating in a population-based cohort study in the Netherlands. Dietary intake during pregnancy was assessed with food-frequency questionnaires. Three a posteriori-derived dietary patterns were identified using factor analysis: a “Vegetable, oil and fish”, a “Nuts, high-fibre cereals and soy”, and a “Margarine, sugar and snacks” pattern. An a priori-defined dietary pattern was based on national dietary recommendations. Weight was repeatedly measured around 13, 20 and 30 weeks of pregnancy; pre-pregnancy and maximum weight were self-reported. Normal-weight women with 1 SDS higher score on the “Nuts, high-fibre cereals and soy” pattern gained weight slightly slower, while normal-weight women with higher adherence to the “Margarine, sugar and snacks” pattern had higher weight (0.3kg; 95% CI [0.07, 0.52]) throughout pregnancy. Normal-weight women with higher adherence to the “Vegetable, oil and fish” pattern had 16 g/week (95% CI [6.5, 25.6]) higher early-pregnancy GWG. The a priori-defined pattern was not associated with GWG. In conclusion, specific dietary patterns may play a role in early pregnancy but were not consistently associated with GWG in our data.
3.1 Introduction
Abnormal maternal weight gain during pregnancy (i.e., too little or too much) has been associated with unfavourable pregnancy outcomes in both mother and child. Insufficient gestational weight gain (GWG) is associated with both preterm birth and low birthweight (Han et al. 2011), and excessive GWG increases the risk of giving birth to large-for-gestational-age infants (Kim et al. 2014). Excessive GWG is also associated with maternal pregnancy complications, including hypertensive disorders (Johnson et al. 2013; Gaillard et al. 2013) and gestational diabetes (Hedderson, Gunderson, and Ferrara 2010), which can increase the risk of the mother developing cardiometabolic diseases after pregnancy (Brown et al. 2013; Bellamy et al. 2009).
Energy intake during pregnancy is associated with GWG (Gaillard et al. 2013; Streuling et al. 2011), but literature is scarce on whether GWG could be influenced by dietary composition. Some studies have examined the influence of food groups on GWG (Stuebe, Oken, and Gillman 2009; Olafsdottir et al. 2006; Martins and Benicio 2011). These studies found no association of fruit or vegetable intake with GWG (Stuebe, Oken, and Gillman 2009; Martins and Benicio 2011) but unhealthier foods (e.g., sweets and processed foods) were associated with higher prevalence of excessive GWG (Stuebe, Oken, and Gillman 2009; Olafsdottir et al. 2006; Martins and Benicio 2011). Weight gain during pregnancy involves both maternal components (e.g., blood volume increase, fat accretion) and fetal components (e.g., weight of the fetus, amniotic fluid) (Pitkin 1976). Therefore, the effect of diet on weight gain may differ between pregnant and non-pregnant women.
Assessing overall diet in relation to GWG has several advantages over studying individual foods or nutrients. First, the intakes of different nutrients are often highly correlated, which complicates the assessment of individual nutrients (Hu 2002). Second, possible associations between nutrient intake and GWG might be affected by biological interactions between nutrients (Hu 2002). For these reasons, evaluating diet using a dietary pattern approach may improve our understanding of which patterns of diet are most beneficial during pregnancy. Moreover, this approach can facilitate future food-based dietary guidelines (World Health Organization and Food and Agriculture Organization of the United Nations 1998).
Only a few studies have focused on the relationship between dietary patterns and GWG (Uusitalo et al. 2009; Shin et al. 2014; Rifas-Shiman et al. 2009; Hillesund et al. 2014). However, no study evaluated dietary patterns and longitudinal development of weight during pregnancy. We hypothesized that specific dietary patterns may influence the development of maternal weight during pregnancy. In addition, dietary patterns are likely to differ between countries and populations (Hu 2002), hence, it is important to identify country-specific dietary patterns that may be associated with GWG.
Therefore, the purpose of our study was to determine whether a priori-defined and a posteriori-derived dietary patterns are associated with weight development during pregnancy and GWG during different phases in pregnancy in Dutch women participating in a population-based cohort.
3.2 Experimental Section
3.2.1 Study Design
This study was embedded in the Generation R Study, a population-based prospective cohort from fetal life onwards in Rotterdam, the Netherlands. Details of this study have been described previously (Kruithof et al. 2014). Briefly, pregnant women with an expected delivery date between April 2002 and January 2006, living in the urban area around Rotterdam, were approached to participate. All participants provided written informed consent. The study was conducted according to the World Medical Association Declaration of Helsinki and was approved by the Medical Ethics Committee, Erasmus Medical Center Rotterdam (the Netherlands, MEC 198.782.2001.31).
3.2.2 Population of Analysis
For the current analysis, women of Dutch ancestry who entered the Generation R Study during pregnancy (n = 4097) were included. Women of non-Dutch ancestry were excluded from the analysis since the dietary assessment method that was used was designed to evaluate a Dutch diet. Furthermore, women with missing dietary information (n = 538) were excluded and only women with singleton live births (n = 3479) were considered. For five women weight during pregnancy was not measured and women who were underweight before pregnancy (body mass index (BMI) < 18.5 kg/m2; n = 100) were excluded, leaving 3374 women for the current analysis (Figure ).
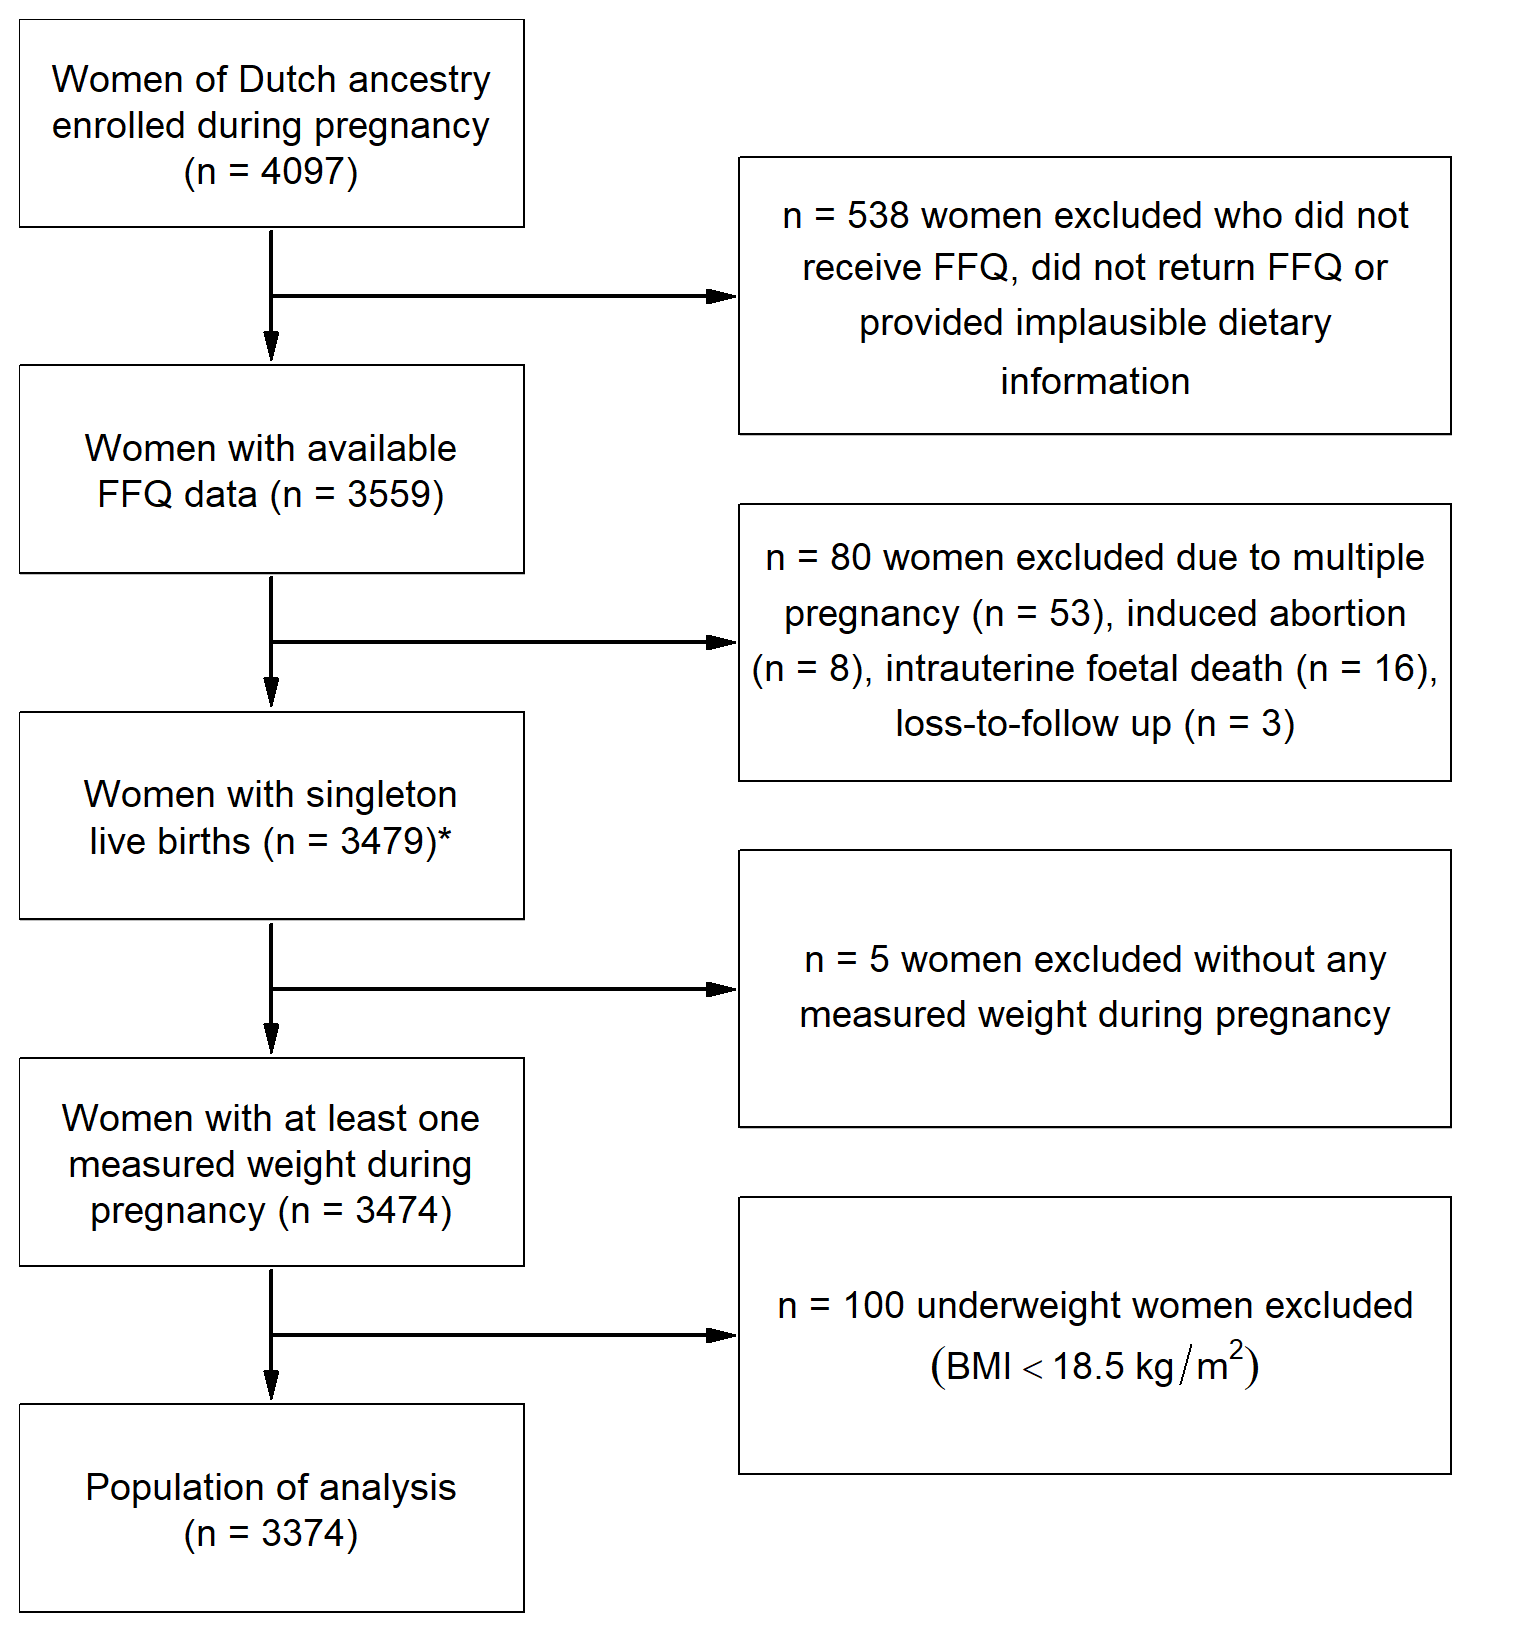
Figure 3.1: Flow chart of the study population: the Generation R Study (2002–2006). * Population in which the -derived dietary patterns were determined. (BMI: body mass index; FFQ: food-frequency questionnaire)
3.2.3 Dietary Assessment
Dietary intake in early pregnancy was assessed at enrolment (median: 13.4 weeks of gestation, Q3 – Q1: 12.2 – 15.5) using a 293-item semi-quantitative food-frequency questionnaire (FFQ) that covered dietary intake over the preceding three months. The FFQ contained questions regarding foods that are frequently consumed in a traditional Dutch diet, their consumption frequency, portion size (Donders-Engelen and Heijden 2003), preparation methods, and additions to foods. The average daily intake of energy and nutrients was calculated using the Dutch food-composition table (Netherlands Nutrition Center 2006). The FFQ was designed for and validated in an elderly population (Klipstein-Grobusch et al. 1998), and has additionally been validated against three 24-h dietary recalls in 71 Dutch pregnant women who visited a midwifery in Rotterdam. The intra-class correlation coefficients for energy-adjusted macronutrients ranged between 0.48 and 0.68.
A Posteriori-Derived Dietary Patterns
We used three a posteriori-derived dietary patterns, which had been identified previously by factor analysis using the principal component method and Varimax rotation (Hu 2002; Kaiser 1958), and are described in detail elsewhere (Van den Broek et al. 2015). Briefly, the 293 individual food items from the FFQ were aggregated into 23 food groups. Subsequently, factors that had an eigenvalue of \(\geq\) 1.5 were extracted and are regarded as dietary patterns (Jolliffe 2011). The factor loadings, which describe the contribution of each food group to each of the patterns, are presented in Table 3.1. Finally, factor scores (i.e., adherence scores) for each participant and each pattern were determined by calculating the individual sum of the intake of the food groups, weighting them with their factor loadings and standardizing those weighted sums to have mean zero and standard deviation one (standard deviation score). A higher factor score indicates that a woman’s diet was closer to that dietary pattern.
Three a posteriori-derived dietary patterns were thereby identified, namely a “Vegetable, oil and fish” pattern, a “Nuts, high-fibre cereals and soy” pattern and a “Margarine, sugar and snacks” pattern, together explaining 25.8% of the variance in maternal dietary intake.
| Food Group | Vegetable, Oil and Fish | Nuts, High-Fibre Cereals and Soy | Margarine, Sugar and Snacks |
|---|---|---|---|
| potatoes and other tubers | 0.05 | -0.53 | 0.21 |
| vegetables | 0.78 | 0.17 | -0.03 |
| fruits | 0.13 | 0.37 | 0.02 |
| dairy products—high fat | 0.26 | -0.26 | 0.29 |
| dairy products—low fat | -0.15 | 0.29 | 0.16 |
| cereals—high fiber | 0.24 | 0.43 | 0.36 |
| cereals—low fiber | 0.23 | -0.16 | 0.25 |
| meat and meat products | 0.08 | -0.54 | 0.33 |
| fish and shellfish | 0.45 | 0.24 | -0.11 |
| eggs and egg products | 0.27 | 0.05 | 0.19 |
| vegetable oils | 0.74 | 0.08 | -0.12 |
| margarine and butter | -0.06 | -0.03 | 0.61 |
| sugar and confectionary and cakes | -0.11 | 0.13 | 0.56 |
| snacks | 0.05 | 0.08 | 0.4 |
| coffee and tea | 0.28 | 0.34 | 0.1 |
| sugar-containing beverages | -0.14 | -0.28 | 0.29 |
| light soft drinks | 0.13 | 0.28 | 0.02 |
| alcoholic beverages | 0.35 | 0 | -0.04 |
| condiments and sauces | 0.05 | -0.09 | 0.39 |
| soups and bouillon | 0.19 | -0.02 | 0.15 |
| nuts, seeds and olives | 0.03 | 0.64 | 0.3 |
| soy products | 0.01 | 0.39 | -0.1 |
| legumes | 0.44 | -0.02 | 0.07 |
3.2.3.1 A Priori-Defined Dietary Pattern
The a priori-defined dietary pattern was based on the Dutch Healthy Diet Index (Van Lee et al. 2012). This index was developed to measure adherence to the Dutch guidelines for a healthy diet (Health Council of the Netherlands 2006) and consisted of ten components: physical activity, vegetable, fruit, dietary fibre, fish, saturated fatty acids, trans-fatty acids, consumption of acidic drinks and foods, sodium, and alcohol. We omitted the components physical activity, trans-fatty acids, and the consumption of acidic drinks and foods because this information had not been collected. Furthermore, we did not include the alcohol component as alcohol abstinence is recommended during pregnancy. The score of each component ranged between 0 and 10 points, resulting in a total score ranging from 0 to 60 points. A higher score on the Dutch Healthy Diet Index corresponds with a higher adherence to the 2006 Dutch healthy diet guidelines and thus reflects a healthier diet. Finally, to facilitate comparison between all dietary patterns, we standardized the “Dutch Healthy Diet Index” pattern to a standard deviation score.
3.2.4 Maternal Weight Gain
Information on pre-pregnancy weight was collected at enrolment using a questionnaire and was used to calculate pre-pregnancy BMI (kg/m2). Women visited our research centre three times at median gestational ages of 12.9 (Q3 – Q1: 12.1 – 14.4) weeks (first visit), 20.4 (Q3 – Q1: 19.9 –- 21.1) weeks (second visit), and 30.2 (Q3 – Q1: 29.9 – 30.8) weeks (third visit). During each visit, maternal height and weight were measured without shoes and heavy clothing. Six weeks after childbirth, women were asked to report their highest weight during pregnancy using a questionnaire, which we used as maximum weight in pregnancy.
Gestational Weight Gain during Different Phases in Pregnancy
GWG in different phases of pregnancy was calculated for three consecutive periods, namely early-pregnancy GWG (calculated as weight at the first visit minus pre-pregnancy weight, divided by follow-up duration (g/week), n = 2425), mid-pregnancy GWG (calculated as weight at the second visit minus weight the first visit, divided by follow-up duration (g/week), n = 2748), and late-pregnancy GWG (calculated as weight at the third visit minus weight at the second visit, divided by follow-up duration (g/week), n = 3158). GWG until early-third trimester was calculated as weight at the third visit minus pre-pregnancy weight, divided by follow up duration (g/week, n = 2815).
3.2.5 Covariates
Several maternal sociodemographic and lifestyle characteristics were considered as potential confounders. We obtained information from prenatal questionnaires that were sent in different trimesters regarding maternal age, educational level (Van Rossem et al. 2009), household income (\(\leq\) 2200 vs >2200 euro/month), parity (no child vs \(\geq\) 1 child), pre-pregnancy weight, pre-existing comorbidities, vomiting, smoking or alcohol consumption (both categorized as never during pregnancy, stopped when pregnancy was known, or continued throughout pregnancy), folic acid supplementation (started periconceptionally, started first 10 weeks, or no supplementation), energy intake, and stress during pregnancy (using the Global Severity Index (Derogatis and Spencer 1993)). To calculate pre-pregnancy BMI, height was measured at enrolment. Gestational age was determined based on ultrasound examination, and during the third visit an ultrasound was performed to estimate fetal weight. Information on fetal sex was obtained from delivery reports.
3.2.6 Statistical Analyses
In order to adequately estimate the relationship between a posteriori-derived dietary patterns and trajectories of gestational weight in the presence of incomplete covariates, we performed a longitudinal analysis using linear mixed modelling in the Bayesian framework. This method has been described in detail previously (Erler et al. 2016) and allows for simultaneous analysis and imputation of missing values. Briefly, by modelling the joint distribution of exposure, outcome and covariates, all available information is used to impute the missing values, and parameter estimates are obtained that take into account the added uncertainty due to the missing values.
We considered two sets of possible confounders in the analysis. Model 1 was adjusted for gestational age at the mid-point of the follow-up interval and pre-pregnancy BMI. Model 2 was further adjusted for age, educational level, household income, parity, smoking during pregnancy, alcohol consumption during pregnancy, stress during pregnancy, and fetal sex. The selection of potential confounders was based on factors found in the literature and on a change of at least 10% in effect estimate in a preliminary analysis assessing the association of dietary patterns with GWG until early-third trimester. As GWG is related to BMI (Institute of Medicine and National Research Council 2009) and preliminary analyses showed significant interaction terms for the “Vegetable, oil and fish” pattern and the “Nuts, high-fibre cereals and soy” pattern with pre-pregnancy BMI, we stratified all analyses (including the Bayesian linear mixed model) on the basis of weight status (normal-weight: BMI < 25 kg/m2 and overweight: BMI \(\geq\) 25 kg/m2).
In the Bayesian linear mixed model, all main effects from Model 2 (except gestational age at the mid-point of the follow-up interval), interaction terms between the dietary pattern variables and a linear and quadratic effect for gestational age were included in the fixed effects structure. Correlation between weight measurements within each individual was modelled by including random effects for the intercept and slope (for gestational age) into the model. For this analysis, the reported parameter estimates and 95% credible intervals were obtained by taking the mean and 2.5% and 97.5% quantiles of the posterior samples.
To analyse the association of the a priori-defined and a posteriori-derived dietary patterns with GWG during different phases in pregnancy, specifically GWG during each trimester, until early third trimester and maximal GWG, we performed multivariable linear regression analysis on imputed datasets. For these analyses, ten imputed values were drawn from the posterior samples of each of the incomplete covariates derived in the Bayesian analysis described above. Missing observations of gestational weight were not imputed. The reported results from the cross-sectional models were pooled over all ten completed datasets using Rubin’s rules (Rubin 1987).
Sensitivity Analyses
To test the stability of the results, four sensitivity analyses for the association between dietary patterns and GWG until early-third trimester were performed in Model 2. First, because energy intake may be an intermediate factor in the association of maternal diet with GWG, we further adjusted for energy intake (kcal/day). Second, we excluded women with pre-existing comorbidities (n = 182) and women with hypertensive complications in pregnancy (Coolman et al. 2010) or gestational diabetes (n = 272) since these conditions may influence both dietary intake and GWG. Third, we excluded women who reported vomiting more than once per week during the three months prior to enrolment (n = 421), since this might alter dietary intake and GWG. Moreover, we explored effect modification of the association between dietary patterns and GWG with educational level and household income.
Additionally, we evaluated whether the associations of dietary patterns with GWG would markedly change when using self-reported maximum weight during pregnancy instead of measured weight at the third visit (n = 1917). Furthermore, we explored long-term maternal weight gain and evaluated whether this long-term weight gain differed in women with inadequate, adequate or excessive GWG using Analysis of Variance (ANOVA). The cut-off values of adequate weekly GWG were 0.35 –- 0.50 kg/week for normal weight women, 0.23 –- 0.33 kg/week for overweight women, and 0.17 –- 0.27 kg/week for obese women (Institute of Medicine and National Research Council 2009). Finally, we calculated the correlation between weight at the third visit and weight 6 years after childbirth.
All statistical analyses were performed in SPSS version 21.0 (IBM Corp., Armonk, NY, USA) or R version 3.2.1 (R Foundation for Statistical Computing, Vienna, Austria) and JAGS version 3.4.0 (Plummer 2003).
3.3 Results
3.3.1 Study Population
Baseline characteristics for normal-weight women (n = 2544; 75%) and overweight women (n = 830; 25%) are presented in Table 3.2. The mean score \(\pm\) SD on the Dutch Healthy Diet Index was \(32 \pm 8\) and ranged from 8 to 59. Overall, 43% of women had excessive GWG (n = 826); excessive GWG was found in 37% of the normal-weight women (n = 557) and in 63% of the overweight women (n = 269).
| subject characteristic |
normal-weight women (n = 2544) |
overweight women (n = 830) |
|---|---|---|
| Age (years) | 31.6 (\(\pm\) 4.3) | 31.0 (\(\pm\) 4.4) |
| Educational level (1.3% NA) | ||
| Low and midlow | 307 (12.1%) | 201 (24.2%) |
| Midhigh | 1283 (50.4%) | 436 (52.5%) |
| High | 954 (37.5%) | 193 (23.3%) |
| Household income (10.3% NA) | ||
| < 2200 Euro/month | 620 (24.4%) | 266 (32.1%) |
| \(\geq\) 2200 Euro/month | 1924 (75.6%) | 564 (67.9%) |
| Parity (0.2% NA) | ||
| 0 | 1554 (61.1%) | 465 (56.0%) |
| \(\geq\) 1 | 990 (38.9%) | 365 (44.0%) |
| Pre-pregnancy BMI (kg/m2; 14.2% NA) | 21.6 [20.4, 23.0] | 27.7, [26.0, 30.5] |
| Smoking during pregnancy (7.4% NA) | ||
| Never during pregnancy | 1911 (75.1%) | 612 (73.7%) |
| Until pregnancy was known | 233 (9.2%) | 61 (7.3%) |
| Continued throughout pregnancy | 400 (15.7%) | 157 (19.0%) |
| Alcohol consumption during pregnancy (8.1% NA) | ||
| Never during pregnancy | 764 (30.0%) | 359 (43.2%) |
| Until pregnancy was known | 416 (16.4%) | 138 (16.6%) |
| Continued throughout pregnancy | 1364 (53.6%) | 334 (40.2%) |
| Stress during pregnancy (score 0–4; 12% NA) | 0.12 [0.06, 0.24] | 0.13 [0.06; 0.26] |
| Energy intake (kcal/day) | 2162 (\(\pm\) 507) | 2090 (\(\pm\) 514) |
| Dutch Healthy Diet Index (score 0–60) | 32 (\(\pm\) 8) | 30 (\(\pm\) 8) |
| Fetal sex | ||
| Male | 1287 (50.6%) | 415 (50.0%) |
| Female | 1257 (49.4%) | 415 (50.0%) |
| Gestational weight gain (kg; 43.2% NA) | 14.7 (\(\pm\) 7.3) | 12.9 (\(\pm\) 7.7) |
| Adequacy of gestational weight gain (43.2% NA) | ||
| Inadequate | 370 (24.8%) | 89 (20.9%) |
| Adequate | 565 (37.9%) | 67 (15.8%) |
| Excessive | 557 (37.3%) | 269 (63.3%) |
3.3.2 Dietary Patterns and Trajectories of Gestational Weight
Results from the Bayesian linear mixed models for normal-weight and overweight women are summarized in Table 3.3 and visualized in Figure 3.2. The figure shows the expected gestational weight over time with corresponding 95% credible intervals under six different scenarios. In each scenario the expected weight, either for normal-weight or overweight women, is shown for a -0.5 SDS and 0.5 SDS adherence to one of the a posteriori-derived dietary patterns, while the adherence to the other patterns and confounders are held constant at reference values (0 SDS for adherence to other dietary patterns, and population median and reference category for continuous and categorical confounders, respectively).
In both normal-weight and overweight women, there was no evidence of either main effects of diet or interaction with gestational age for most dietary patterns (Table 3.3). Only adherence to the “Margarine, sugar and snacks” pattern was associated with higher weight in normal-weight women (0.30; 95% CI [0.07, 0.52]) and the “Nuts, high-fibre cereals and soy” pattern was associated with slightly slower weight gain in normal-weight women (-0.01; 95% CI [-0.02, -0.00]).
| pattern | 0.22 [-0.01, 0.44] | 0.26 [-0.18, 0.72] |
| pattern | 0.15 [-0.08, 0.39] | -0.31 [-0.77, 0.14] |
| pattern | 0.30 [0.07, 0.52] | 0.32 [-0.07, 0.71] |
| gest. age | 0.13 [0.12, 0.14] | 0.10 [0.08, 0.12] |
| gest. age | 0.01 [0.01, 0.01] | 0.01 [0.01, 0.01] |
| gest. age \(\times\) pattern | -0.00 [-0.01, 0.01] | 0.01 [-0.01, 0.02] |
| gest. age \(\times\) pattern | -0.01 [-0.02, -0.00] | 0.01 [-0.00, 0.02] |
| gest. age \(\times\) pattern | 0.01 [-0.00, 0.01] | 0.00 [-0.01, 0.02] |
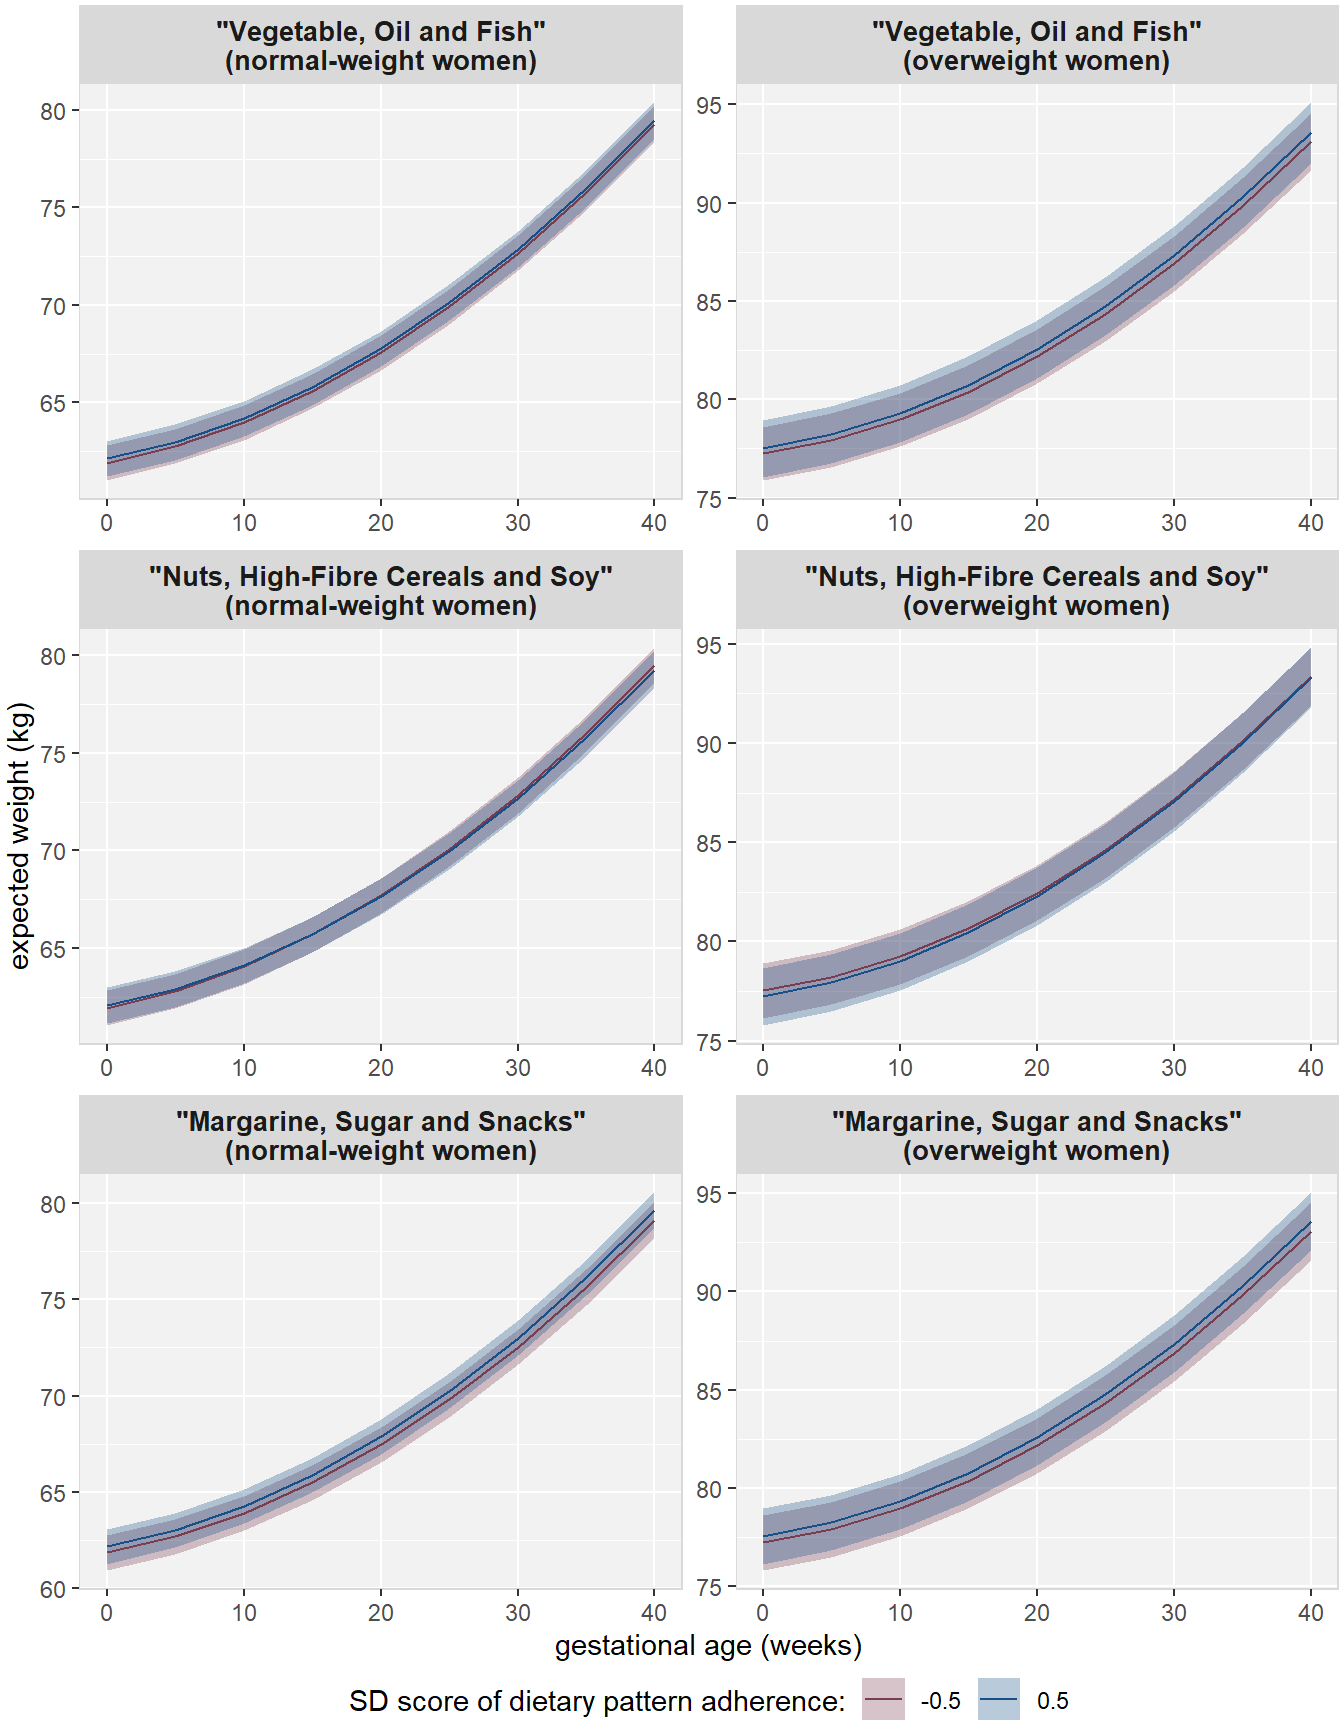
Figure 3.2: Visualization of the effect of diet on gestational weight over time. Shown are the expected value and corresponding 95% CIs for hypothetical cases that have either -0.5 or 0.5 SDS for adherence to the respective dietary pattern and reference values for the other patterns and confounders.
3.3.3 Dietary Patterns and Gestational Weight Gain in Different Phases in Pregnancy
For normal-weight women a 1 SDS higher adherence to the “Vegetable, oil and fish” pattern was associated with a 16 g/week (95% CI [6.5, 25.6]) greater early-pregnancy GWG when adjusting for lifestyle and sociodemographic variables (Table 3.4). We observed no such association in overweight women (Table 3.5). The “Nuts, high-fibre cereals and soy” pattern was associated with lower early-pregnancy GWG in Model 1 in both normal-weight and overweight women. However, after additional adjustment (Model 2) this pattern was no longer significantly associated with early-pregnancy GWG. Neither the “Margarine, sugar and snacks” pattern nor the “Dutch Healthy Diet Index” pattern was associated with early-pregnancy GWG.
| a posteriori dietary patterns | ||
| Vegetable, Oil and Fish | 14.3 [ 5.2, 23.4] | 16.0 [ 6.5, 25.6] |
| Nuts, High-Fibre Cereals and Soy | -14.5 [-23.7, -5.3] | -6.5 [-16.4, 3.5] |
| Margarine, Sugar and Snacks | 7.6 [ -1.7, 17.0] | 4.4 [ -4.9, 13.7] |
| a priori dietary pattern | ||
| Dutch Healthy Diet Index | 0.8 [ -8.3, 9.9] | -6.2 [-15.5, 3.1] |
| a posteriori dietary patterns | ||
| Vegetable, Oil and Fish | 5.8 [-17.8, 29.5] | 14.8 [-11.2, 40.7] |
| Nuts, High-Fibre Cereals and Soy | -28.8 [-52.2, -5.4] | -24.0 [-48.8, 0.7] |
| Margarine, Sugar and Snacks | 14.1 [ -7.3, 35.5] | 12.4 [ -9.0, 33.9] |
| a priori dietary pattern | ||
| Dutch Healthy Diet Index | 10.8 [-10.3, 31.9] | 2.4 [-19.5, 24.2] |
No significant associations were found for any of the dietary patterns with mid-pregnancy GWG in normal-weight or overweight women (Tables 3.6 and 3.7). Tables 3.8 and 3.9 show that in normal-weight women, only the “Nuts, high-fibre cereals and soy” pattern was inversely associated with late-pregnancy GWG in Model 1, but these results largely attenuated after adjustment for sociodemographic and lifestyle factors (Model 2). In overweight women, none of the dietary patterns was significantly associated with late-pregnancy GWG.
| a posteriori dietary patterns | ||
| Vegetable, Oil and Fish | -8.5 [-22.0, 5.0] | -7.1 [-21.4, 7.2] |
| Nuts, High-Fibre Cereals and Soy | 9.5 [ -4.1, 23.2] | 11.3 [ -3.6, 26.2] |
| Margarine, Sugar and Snacks | 3.9 [ -9.7, 17.5] | 4.2 [ -9.5, 18.0] |
| a priori dietary pattern | ||
| Dutch Healthy Diet Index | 3.2 [-10.2, 16.6] | 2.8 [-11.2, 16.7] |
| a posteriori dietary patterns | ||
| Vegetable, Oil and Fish | 35.6 [ 6.1, 65.1] | 19.1 [-13.8, 52.0] |
| Nuts, High-Fibre Cereals and Soy | 23.5 [ -5.7, 52.7] | 3.5 [-28.0, 34.9] |
| Margarine, Sugar and Snacks | 8.3 [-18.3, 34.8] | 14.5 [-12.3, 41.4] |
| a priori dietary pattern | ||
| Dutch Healthy Diet Index | -17.9 [-44.7, 8.9] | -2.2 [-30.0, 25.7] |
| a posteriori dietary patterns | ||
| Vegetable, Oil and Fish | -8.3 [-18.3, 1.6] | -3.9 [-14.4, 6.6] |
| Nuts, High-Fibre Cereals and Soy | -13.2 [-23.4, -3.0] | -4.6 [-15.6, 6.3] |
| Margarine, Sugar and Snacks | 0.3 [ -9.8, 10.5] | 0.4 [ -9.8, 10.5] |
| a priori dietary pattern | ||
| Dutch Healthy Diet Index | 3.2 [ -6.7, 13.2] | -1.5 [-11.8, 8.8] |
| a posteriori dietary patterns | ||
| Vegetable, Oil and Fish | -3.8 [-24.5, 16.9] | 7.4 [-15.5, 30.2] |
| Nuts, High-Fibre Cereals and Soy | 4.4 [-17.0, 25.8] | 9.5 [-13.4, 32.3] |
| Margarine, Sugar and Snacks | -8.5 [-28.0, 11.1] | -9.8 [-29.5, 10.0] |
| a priori dietary pattern | ||
| Dutch Healthy Diet Index | 2.1 [-17.6, 21.7] | 0.2 [-20.1, 20.5] |
3.3.4 Sensitivity Analyses
The results of the sensitivity analyses are presented in Tables 3.10 – 3.14. In line with the results from early-pregnancy GWG, normal-weight women with a 1 SDS higher adherence to the “Vegetable, oil and fish” pattern had 6.7 g/week (95% CI [0.9, 12.5]) higher GWG until the early-third trimester, whereas no association was found in overweight women. The other dietary patterns were not associated with GWG until the early-third trimester (Table 3.10).
Additional adjustment for energy intake resulted in attenuation of the effect estimate of the “Vegetable, oil and fish” pattern with GWG until early-third trimester. The results did not alter greatly after exclusion of women who vomited more than once per week (Table 3.12) or exclusion of women with pre-existing comorbidities or pregnancy complications (Table 3.13). The evaluation of maximum GWG showed results that were in line with the results of the previous analyses (Table 3.14).
The association between dietary patterns and GWG was not modified by educational level or household income.
Six years after childbirth, women had gained on average 3.4 kg (Q1, Q3: 0.4, 7.0) compared to their pre-pregnancy weight (n = 2247). The median (Q1, Q3) long-term weight gain was significantly different between the categories of GWG adequacy: women with inadequate GWG gained 2.2 kg (-0.6, 5.2), those with adequate GWG gained on average 2.6 kg (0.2, 5.2), and women with excessive GWG were 4.6 kg (1.4, 8.8) heavier (F-test 27.5, p-value < 0.001). The weight 6 years after childbirth was highly correlated with the weight at the third visit in pregnancy (R = 0.85; p-value < 0.001).
3.4 Discussion
3.4.1 Summary of the Main Findings
The results from our analysis of a population-based Dutch cohort suggest that specific a posteriori-derived dietary patterns have limited influence on early-pregnancy GWG, the prevalence of excessive GWG, and weight development in pregnancy. We neither found consistent associations of any dietary pattern with the prevalence of inadequate GWG nor was the a priori-defined dietary pattern associated with GWG.
3.4.2 Interpretation and Comparison with other Studies
The association of dietary patterns during pregnancy with GWG has been evaluated previously in a few studies (Uusitalo et al. 2009; Shin et al. 2014; Rifas-Shiman et al. 2009; Hillesund et al. 2014), but these studies did not evaluate longitudinal development of gestational weight and were conducted in different populations. Uusitalo et al. (2009) found that higher adherence to an a posteriori-derived dietary pattern characterized by high intake of sweets, fast food and snacks was associated with higher weekly GWG. In line with these results, we found that higher adherence to the unhealthy “Margarine, sugar and snacks” pattern was associated with higher prevalence of excessive GWG. Additionally, Uusitalo et al. (2009) reported that a pattern that was high in vegetables, fish and fruits was not associated with GWG. In contrast, we found that the “Vegetable, oil and fish” pattern, a relatively healthy pattern, was associated with higher GWG in early pregnancy.
In our study, the a priori-defined “Dutch Healthy Diet Index” pattern was not consistently associated with any measure of GWG. This result was in accordance with two studies showing no relationship between the a priori-defined “US healthy eating index of 2005” (HEI-2005) and the “Alternate Healthy Eating Index, slightly modified for pregnancy” (AHEI-P) with the prevalence of inadequate or excessive GWG (Shin et al. 2014; Rifas-Shiman et al. 2009). Nevertheless, a large population-based cohort study of over 66,000 participants found that high adherence to the a priori-defined “New Nordic Diet score” was associated with a 7% lower prevalence of excessive GWG in normal weight women, compared with low adherence (Hillesund et al. 2014). The inconsistency in findings regarding the associations between the a priori-defined dietary patterns may be due to different items that were included in the diet scores. The “New Nordic Diet score” contained items on meal patterns and the type of beverages consumed, among others (Hillesund et al. 2014); these items were not evaluated in our Dutch Healthy Diet Index, nor in other a priori-defined dietary patterns (Shin et al. 2014; Rifas-Shiman et al. 2009).
The association of a posteriori-derived dietary patterns with weight trajectories over pregnancy has not been evaluated previously, to our knowledge. Studying this association longitudinally has the advantage that all available weight measurements can be used while taking into account the correlation between these measurements. In addition, weekly GWG is not constant over pregnancy and differs considerably by individual (Institute of Medicine and National Research Council 2009; Carmichael, Abrams, and Selvin 1997), which complicates cross-sectional comparisons of GWG. Our longitudinal analysis showed that women with higher adherence to the “Nuts, high-fibre and soy” pattern had a more moderate increase in weight during pregnancy than did women with low adherence to this dietary pattern, although absolute differences were small.
Results from both observational and interventional studies indicated that women with higher energy intake had higher GWG compared with women who have lower energy intake (Streuling et al. 2011), results that were also found in our cohort (Gaillard et al. 2013). In our analyses, the association of the “Vegetable, oil and fish” pattern remained significantly associated with GWG after additional adjustment for energy intake. This may indicate that dietary patterns are associated with GWG beyond energy intake.
Evaluating weight gain in pregnancy is important because GWG has been associated with many adverse pregnancy and birth outcomes. Gaining excessive weight during pregnancy can have short-term consequences such as delivery complications, and giving birth to a child that is large for its gestational age (Johnson et al. 2013; Gaillard et al. 2013; Institute of Medicine and National Research Council 2009). Additionally, it has been associated with long-term health consequences including post-partum obesity of the mother (Nehring et al. 2011) due to retaining their excess fat mass, and childhood obesity (Gaillard et al. 2013). Indeed, in our population, six years after childbirth women had gained on average 3.4 kg compared to their pre-pregnancy weight.
Weight gain during pregnancy consists of several maternal and fetal components that contribute differently to GWG over time (Pitkin 1976). For example, during the first half of pregnancy, maternal fat gain is a major contributor of GWG (Clapp et al. 1988; Kopp-Hoolihan et al. 1999), and most of the fat gain that takes place during pregnancy is in that period (Forsum, Sadurskis, and Wager 1988). In our study, the higher GWG in women with high adherence to the “Vegetable, oil and fish” pattern could not be explained by fetal growth and was mainly found in early pregnancy, meaning this higher GWG is likely due to maternal components, e.g., fat mass.
Our results for normal-weight women differed from those for overweight women, particularly for the “Vegetable, oil and fish” pattern and for the “Nuts, high-fibre cereals and soy” pattern. Similarly, Hillesund et al. (2014) reported differential associations for women below and above a BMI of 25 kg/m2. These difference in findings may be explained by differences in the reporting of dietary intake (Freisling et al. 2012) or by differing contribution of the individual components of GWG for normal-weight and overweight women (Butte et al. 2003). In addition, our longitudinal analyses showed that over the whole course of pregnancy, normal-weight women with higher adherence to the “Margarine, sugar and snacks” pattern tend to be heavier than women with lower adherence.
3.4.3 Strengths and Limitations
A strength of our study is that we used a comprehensive approach to analyse the relation between diet and GWG by evaluating the associations of dietary patterns with trajectories of gestational weight and GWG during different phases in pregnancy. Another strength is the use of two distinct methods to define dietary patterns, which enabled us to evaluate the effects of dietary patterns derived by a data-driven and by a hypothesis-driven approach. Dietary patterns represent the combined effects of all foods consumed (Hu 2002), which may lead to a more powerful effect than the effects of the individual components, although it may also have led to a dilution of the effects of individual components that are associated with GWG (Willett 2012). For example, the food groups of vegetables and high-fat dairy products were strongly associated with the “Vegetable, oil and fish” dietary pattern. Yet, higher intake of fruits and vegetables has been associated with lower GWG (Olson and Strawderman 2003), whereas dairy products were associated with higher GWG (Stuebe, Oken, and Gillman 2009; Olafsdottir et al. 2006). Consequently, this may result in an overall null effect of the dietary pattern. Furthermore, imputing the missing covariate values in the Bayesian framework allowed us to use all available information in the imputation. Especially in settings with a longitudinal outcome, imputation methods that are available in standard software and, hence, are more commonly used, often fail to appropriately include the outcome into the imputation procedure which may lead to severely biased results (Erler et al. 2016). Other strengths of our study are its population-based design, the collection of numerous covariates, and that the population was restricted to women of Dutch ancestry. We excluded women with other ethnicities to minimize measurement error since the FFQ was designed to evaluate a Dutch diet. However, this restriction may have reduced the generalizability of our results to other ethnicities.
Our study also has some limitations. First, maternal weight before pregnancy, as well as maximum weight, were obtained using questionnaires, which may have resulted in a larger measurement error. Although we found no indication of systematic measurement error, random error may have resulted in loss of precision in GWG assessment. Furthermore, we were not able to calculate GWG per trimester because we did not have weight measurements at the required time points and the available data was insufficient for imputing those values. Another limitation is the lack of information on the separate components of GWG, in particular, maternal fat mass, and the lack of information on postpartum maternal weight. Future studies should collect detailed information on maternal body composition during pregnancy or measure the participants’ weight a few weeks postpartum to evaluate associations with the different components of GWG. Furthermore, we could not use information on absolute dietary intake because dietary information collected using an FFQ does not provide this information. However, FFQs have been shown to be accurate in ranking participants according to their dietary intake (Kipnis et al. 2003a). Furthermore, we assessed maternal diet only once during pregnancy and were therefore not able to account for changes in dietary intake. Nevertheless, dietary patterns and macronutrient composition may not change largely during pregnancy despite an increased energy intake (Crozier et al. 2009; Rad et al. 2011). Additionally, we found that our results did not change after excluding women who may have altered their dietary intake due to illness or vomiting. Finally, the numerous statistical analyses performed may have resulted in chance findings (type I error). However, our results for weight trajectories and early-pregnancy GWG remained statistically significant when a more stringent significance level of 1 - 0.05/4 = 0.9875 was used.
3.4.4 Conclusions and Implications
In conclusion, our results suggest that dietary composition during pregnancy may play a role in GWG in early pregnancy but has limited influence on total GWG in a population of Dutch women. The strength of the associations between dietary patterns and GWG differs for different definitions of dietary patterns and GWG. This suggests that the relationship between dietary patterns and GWG may be complex and may need further elucidation in order to facilitate the development of dietary guidelines during pregnancy and to adequately advise pregnant women on their diet.
Appendix
3.A Supplementary Materials
| a posteriori dietary patterns | ||
| Vegetable, Oil and Fish | 6.7 [ 0.9, 12.5] | 10.0 [ -5.0, 25.1] |
| Nuts, High-Fibre Cereals and Soy | -2.0 [ -8.1, 4.0] | -5.6 [-20.7, 9.4] |
| Margarine, Sugar and Snacks | 2.5 [ -3.2, 8.2] | 6.0 [ -7.2, 19.1] |
| a priori dietary pattern | ||
| Dutch Healthy Diet Index | -4.3 [ -10.0, 1.4] | 1.6 [-11.7, 14.9] |
| a posteriori dietary patterns | ||
| Vegetable, Oil and Fish | 3.4 [ -3.0, 9.8] | 8.9 [ -7.3, 25.2] |
| Nuts, High-Fibre Cereals and Soy | -4.8 [-11.2, 1.7] | -6.5 [-22.3, 9.3] |
| Margarine, Sugar and Snacks | -11.8 [-24.6, 1.0] | 1.0 [-29.8, 31.8] |
| a priori dietary pattern | ||
| Dutch Healthy Diet Index | -4.3 [ -10.0, 1.4] | 1.6 [-11.7, 14.9] |
| a posteriori dietary patterns | ||
| Vegetable, Oil and Fish | 8.0 [ 2.0, 14.0] | 9.5 [ -6.0, 24.9] |
| Nuts, High-Fibre Cereals and Soy | -1.4 [ -7.6, 4.9] | -6.0 [-21.6, 9.7] |
| Margarine, Sugar and Snacks | 1.9 [ -4.0, 7.8] | 9.5 [ -4.8, 23.8] |
| a priori dietary pattern | ||
| Dutch Healthy Diet Index | -5.7 [-11.6, 0.2] | 1.3 [-12.6, 15.1] |
| a posteriori dietary patterns | ||
| Vegetable, Oil and Fish | 4.8 [ -1.3, 10.8] | 14.2 [ -2.1, 30.5] |
| Nuts, High-Fibre Cereals and Soy | -2.3 [ -8.6, 4.0] | -7.7 [-23.8, 8.5] |
| Margarine, Sugar and Snacks | 0.5 [ -5.3, 6.4] | 5.2 [ -9.5, 19.8] |
| a priori dietary pattern | ||
| Dutch Healthy Diet Index | -5.2 [-11.0, 0.7] | -4.8 [-19.3, 9.7] |
| a posteriori dietary patterns | ||
| Vegetable, Oil and Fish | 4.4 [ -4.9, 13.8] | -9.3 [-34.0, 15.4] |
| Nuts, High-Fibre Cereals and Soy | 1.4 [ -8.3, 11.2] | 5.2 [-19.5, 29.8] |
| Margarine, Sugar and Snacks | 8.1 [ -1.2, 17.5] | 17.8 [ -6.0, 41.6] |
| a priori dietary pattern | ||
| Dutch Healthy Diet Index | -0.8 [-10.3, 8.7] | 14.4 [ -8.3, 37.2] |
References
Bellamy, Leanne, Juan-Pablo Casas, Aroon D. Hingorani, and David Williams. 2009. “Type 2 Diabetes Mellitus After Gestational Diabetes: A Systematic Review and Meta-Analysis.” The Lancet 373 (9677): 1773–9. https://doi.org/10.1016/S0140-6736(09)60731-5.
Brown, Morven Caroline, Kate Elizabeth Best, Mark Stephen Pearce, Jason Waugh, Stephen Courtenay Robson, and Ruth Bell. 2013. “Cardiovascular Disease Risk in Women with Pre-Eclampsia: Systematic Review and Meta-Analysis.” European Journal of Epidemiology 28 (1): 1–19. https://doi.org/10.1007/s10654-013-9762-6.
Butte, Nancy F., Kenneth J. Ellis, William W. Wong, Judy M. Hopkinson, and E. O’Brian Smith. 2003. “Composition of Gestational Weight Gain Impacts Maternal Fat Retention and Infant Birth Weight.” American Journal of Obstetrics & Gynecology 189 (5): 1423–32. https://doi.org/10.1067/S0002-9378(03)00596-9.
Carmichael, Suzan, Barbara Abrams, and Steve Selvin. 1997. “The Pattern of Maternal Weight Gain in Women with Good Pregnancy Outcomes.” American Journal of Public Health 87 (12): 1984–8. https://doi.org/10.2105/AJPH.87.12.1984.
Clapp, James F., Brian L. Seaward, Robert H. Sleamaker, and John Hiser. 1988. “Maternal Physiologic Adaptations to Early Human Pregnancy.” American Journal of Obstetrics & Gynecology 159 (6): 1456–60. https://doi.org/10.1016/0002-9378(88)90574-1.
Coolman, Marianne, Christianne J. M. de Groot, Vincent W. V. Jaddoe, Albert Hofman, Hein Raat, and Eric A. P. Steegers. 2010. “Medical Record Validation of Maternally Reported History of Preeclampsia.” Journal of Clinical Epidemiology 63 (8): 932–37. https://doi.org/10.1016/j.jclinepi.2009.10.010.
Crozier, Sarah R., Siân M Robinson, Keith M. Godfrey, Cyrus Cooper, and Hazel M. Inskip. 2009. “Women’s Dietary Patterns Change Little from Before to During Pregnancy.” The Journal of Nutrition 139 (10): 1956–63. https://doi.org/10.3945/jn.109.109579.
Derogatis, Leonard R., and P. M. Spencer. 1993. Brief Symptom Inventory: BSI. Pearson Upper Saddle River, NJ.
Donders-Engelen, M., and L. van der Heijden. 2003. “Maten, Gewichten En Codenummers 2003.” In. Zeist, The Netherlands: Wageningen UR, Vakgroep Humane Voeding Wageningen; TNO Voeding.
Erler, Nicole S., Dimitris Rizopoulos, Joost van Rosmalen, Vincent W. V. Jaddoe, Oscar H. Franco, and Emmanuel M. E. H. Lesaffre. 2016. “Dealing with Missing Covariates in Epidemiologic Studies: A Comparison Between Multiple Imputation and a Full Bayesian Approach.” Statistics in Medicine 35 (17): 2955–74. https://doi.org/10.1002/sim.6944.
Forsum, Elisabet, Aija Sadurskis, and Jan Wager. 1988. “Resting Metabolic Rate and Body Composition of Healthy Swedish Women During Pregnancy.” The American Journal of Clinical Nutrition 47 (6): 942–47.
Freisling, Heinz, Marit M. E. van Bakel, Carine Biessy, Anne M. May, Graham Byrnes, Teresa Norat, Sabina Rinaldi, et al. 2012. “Dietary reporting errors on 24 h recalls and dietary questionnaires are associated with BMI across six European countries as evaluated with recovery biomarkers for protein and potassium intake.” British Journal of Nutrition 107 (6): 910–20. https://doi.org/10.1017/S0007114511003564.
Gaillard, Romy, Büşra Durmuş, Albert Hofman, Johan P. Mackenbach, Eric A. P. Steegers, and Vincent W. V. Jaddoe. 2013. “Risk Factors and Outcomes of Maternal Obesity and Excessive Weight Gain During Pregnancy.” Obesity 21 (5): 1046–55. https://doi.org/10.1002/oby.20088.
Han, Zhen, Olha Lutsiv, Sohail Mulla, Allison Rosen, Joseph Beyene, and Sarah D. McDonald. 2011. “Low Gestational Weight Gain and the Risk of Preterm Birth and Low Birthweight: A Systematic Review and Meta-Analyses.” Acta Obstetricia et Gynecologica Scandinavica 90 (9): 935–54. https://doi.org/10.1111/j.1600-0412.2011.01185.x.
Health Council of the Netherlands. 2006. “Guidelines for a Healthy Diet 2006.” Health Council of the Netherlands, The Hague.
Hedderson, Monique M., Erica P. Gunderson, and Assiamira Ferrara. 2010. “Gestational Weight Gain and Risk of Gestational Diabetes Mellitus.” Obstetrics & Gynecology 115 (3): 597. https://doi.org/10.1097/AOG.0b013e3181cfce4f.
Hillesund, Elisabet R., Elling Bere, Margaretha Haugen, and Nina C. Øverby. 2014. “Development of a New Nordic Diet score and its association with gestational weight gain and fetal growth – a study performed in the Norwegian Mother and Child Cohort Study (MoBa).” Public Health Nutrition 17 (9): 1909–18. https://doi.org/10.1017/S1368980014000421.
Hu, Frank B. 2002. “Dietary Pattern Analysis: A New Direction in Nutritional Epidemiology.” Current Opinion in Lipidology 13 (1): 3–9.
Institute of Medicine and National Research Council. 2009. Weight Gain During Pregnancy: Reexamining the Guidelines. Edited by Kathleen M. Rasmussen and Ann L. Yaktine. Washington, DC: The National Academies Press. https://doi.org/10.17226/12584.
Johnson, Julie, Rebecca G. Clifton, James M. Roberts, Leslie Myatt, John C. Hauth, Catherine Y. Spong, Michael W. Varner, et al. 2013. “Pregnancy Outcomes With Weight Gain Above or Below the 2009 Institute of Medicine Guidelines.” Obstetrics & Gynecology 121 (5): 969. https://doi.org/10.1097/AOG.0b013e31828aea03.
Jolliffe, Ian. 2011. “Principal Component Analysis.” In International Encyclopedia of Statistical Science, edited by Miodrag Lovric, 1094–6. Berlin, Heidelberg: Springer. https://doi.org/10.1007/978-3-642-04898-2_455.
Kaiser, Henry F. 1958. “The Varimax Criterion for Analytic Rotation in Factor Analysis.” Psychometrika 23 (3): 187–200. https://doi.org/10.1007/BF02289233.
Kim, Shin Y., Andrea J. Sharma, William Sappenfield, Hoyt G. Wilson, and Hamisu M. Salihu. 2014. “Association of Maternal Body Mass Index, Excessive Weight Gain, and Gestational Diabetes Mellitus With Large-for-Gestational-Age Births.” Obstetrics & Gynecology 123 (4): 737. https://doi.org/10.1097/AOG.0000000000000177.
Kipnis, Victor, Amy F. Subar, Douglas Midthune, Laurence S. Freedman, Rachel Ballard-Barbash, Richard P. Troiano, Sheila Bingham, Dale A. Schoeller, Arthur Schatzkin, and Raymond J. Carroll. 2003a. “Structure of Dietary Measurement Error: Results of the OPEN Biomarker Study.” American Journal of Epidemiology 158 (1): 14–21. https://doi.org/10.1093/aje/kwg091.
Klipstein-Grobusch, Kerstin, J. H. den Breeijen, R. A. Goldbohm, J. M. Geleijnse, A. Hofman, D. E. Grobbee, and J. C. M. Witteman. 1998. “Dietary Assessment in the Elderly: Validation of a Semiquantitative Food Frequency Questionnaire.” European Journal of Clinical Nutrition 52 (8): 588–96. https://doi.org/10.1038/sj.ejcn.1600611.
Kopp-Hoolihan, L. E., M. D. Van Loan, W. W. Wong, and J. C. King. 1999. “Fat Mass Deposition During Pregnancy Using a Four-Component Model.” Journal of Applied Physiology 87 (1): 196–202. https://doi.org/10.1152/jappl.1999.87.1.196.
Kruithof, Claudia J., Marjolein N. Kooijman, Cornelia M. van Duijn, Oscar H. Franco, Johan C. de Jongste, Caroline C. W. Klaver, Johan P. Mackenbach, et al. 2014. “The Generation R Study: Biobank update 2015.” European Journal of Epidemiology 29 (12): 911–27. https://doi.org/10.1007/s10654-014-9980-6.
Martins, Ana Paula Bortoletto, and Maria Helena D’Aquino Benicio. 2011. “Influence of Dietary Intake During Gestation on Postpartum Weight Retention.” Revista de Saúde Pública 45 (5): 870–77. https://doi.org/10.1590/S0034-89102011005000056.
Nehring, Ina, Sylvia Schmoll, Andreas Beyerlein, Hans Hauner, and Rüdiger von Kries. 2011. “Gestational Weight Gain and Long-Term Postpartum Weight Retention: A Meta-Analysis.” The American Journal of Clinical Nutrition 94 (5): 1225–31. https://doi.org/10.3945/ajcn.111.015289.
Netherlands Nutrition Center. 2006. “Nevo: Dutch Food Composition Database 2006.” The Hague, the Netherlands: Netherlands Nutrition Centre.
Olafsdottir, Anna S., G. V. Skuladottir, I. Thorsdottir, A. Hauksson, and L. Steingrimsdottir. 2006. “Maternal Diet in Early and Late Pregnancy in Relation to Weight Gain.” International Journal of Obesity 30 (3): 492. https://doi.org/10.1038/sj.ijo.0803184.
Olson, Christine M., and Myla S. Strawderman. 2003. “Modifiable Behavioral Factors in a Biopsychosocial Model Predict Inadequate and Excessive Gestational Weight Gain.” Journal of the Academy of Nutrition and Dietetics 103 (1): 48–54. https://doi.org/10.1053/jada.2003.50001.
Pitkin, Roy M. 1976. “Nutritional Support in Obstetrics and Gynecology.” Clinical Obstetrics and Gynecology 19 (3): 489–513.
Plummer, M. 2003. “JAGS: A Program for Analysis of Bayesian Graphical Models Using Gibbs Sampling.” Edited by Kurt Hornik, Friedrich Leisch, and Achim Zeileis.
Rad, Neda Talai, Claudia Ritterath, Tina Siegmund, Cornelia Wascher, Gerda Siebert, Wolfgang Henrich, and Kai J. Buhling. 2011. “Longitudinal Analysis of Changes in Energy Intake and Macronutrient Composition During Pregnancy and 6 Weeks Post-Partum.” Archives of Gynecology and Obstetrics 283 (2): 185–90. https://doi.org/10.1007/s00404-009-1328-1.
Rifas-Shiman, Sheryl L, Janet W Rich-Edwards, Ken P Kleinman, Emily Oken, and Matthew W Gillman. 2009. “Dietary Quality during Pregnancy Varies by Maternal Characteristics in Project Viva: A US Cohort.” Journal of the Academy of Nutrition and Dietetics 109 (6): 1004–11. https://doi.org/10.1016/j.jada.2009.03.001.
Rubin, Donald B. 1987. Multiple Imputation for Nonresponse in Surveys. Wiley Series in Probability and Statistics. Wiley. https://doi.org/10.1002/9780470316696.
Shin, Dayeon, Leonard Bianchi, Hwan Chung, Lorraine Weatherspoon, and Won O. Song. 2014. “Is Gestational Weight Gain Associated with Diet Quality During Pregnancy?” Maternal and Child Health Journal 18 (6): 1433–43. https://doi.org/10.1007/s10995-013-1383-x.
Streuling, Ina, Andreas Beyerlein, Eva Rosenfeld, Britta Schukat, and Rüdiger von Kries. 2011. “Weight Gain and Dietary Intake During Pregnancy in Industrialized Countries – a Systematic Review of Observational Studies.” Journal of Perinatal Medicine 39 (2): 123–29. https://doi.org/10.1515/jpm.2010.127.
Stuebe, Alison M., Emily Oken, and Matthew W. Gillman. 2009. “Associations of Diet and Physical Activity During Pregnancy with Risk for Excessive Gestational Weight Gain.” American Journal of Obstetrics & Gynecology 201 (1): 58–e1. https://doi.org/10.1016/j.ajog.2009.02.025.
Uusitalo, Ulla, Tuula Arkkola, Marja-Leena Ovaskainen, Carina Kronberg-Kippilä, Mike G. Kenward, Riitta Veijola, Olli Simell, Mikael Knip, and Suvi M. Virtanen. 2009. “Unhealthy Dietary Patterns Are Associated with Weight Gain During Pregnancy Among Finnish Women.” Public Health Nutrition 12 (12): 2392–9. https://doi.org/10.1017/S136898000900528X.
Van den Broek, Marion, Elisabeth T. M. Leermakers, Vincent W. V. Jaddoe, Eric A. P. Steegers, Fernando Rivadeneira, Hein Raat, Albert Hofman, Oscar H. Franco, and Jessica C. Kiefte-de Jong. 2015. “Maternal dietary patterns during pregnancy and body composition of the child at age 6 y: the Generation R Study.” The American Journal of Clinical Nutrition 102 (4): 873–80. https://doi.org/10.3945/ajcn.114.102905.
Van Lee, Linde, Anouk Geelen, Eveline J. C. Hooft van Huysduynen, Jeanne H. M. de Vries, Pieter van’t Veer, and Edith J. M. Feskens. 2012. “The Dutch Healthy Diet index (DHD-index): an instrument to measure adherence to the Dutch Guidelines for a Healthy Diet.” Nutrition Journal 11 (1): 49. https://doi.org/10.1186/1475-2891-11-49.
Van Rossem, Lenie, Anke Oenema, Eric A. P. Steegers, Henriëtte A. Moll, Vincent W. V. Jaddoe, Albert Hofman, Johan P. Mackenbach, and Hein Raat. 2009. “Are Starting and Continuing Breastfeeding Related to Educational Background? The Generation R Study.” Pediatrics 123 (6): e1017–e1027. https://doi.org/10.1542/peds.2008-2663.
Willett, Walter. 2012. Nutritional Epidemiology. Oxford University Press.
World Health Organization, and Food and Agriculture Organization of the United Nations. 1998. “Preparation and Use of Food-Based Dietary Guidelines: Report of a Joint Fao/Who Consultation.”